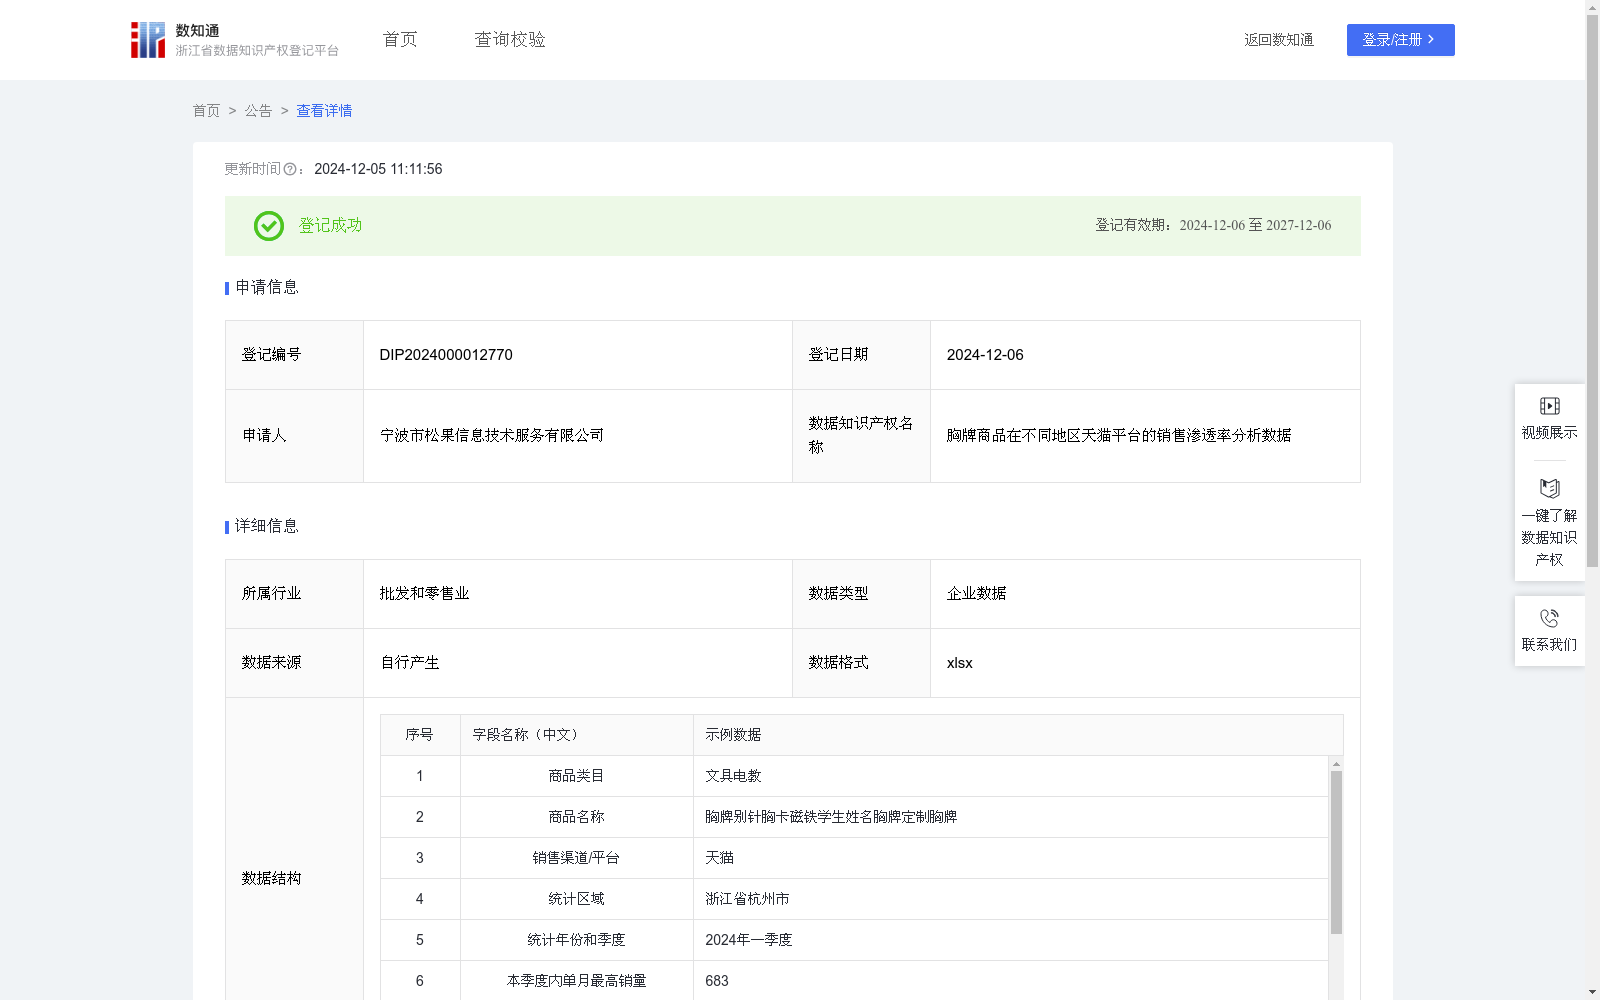
胸牌商品在不同地区天猫平台的销售渗透率分析数据
收藏浙江省数据知识产权登记平台2024-12-05 更新2024-12-06 收录
下载链接:
https://www.zjip.org.cn/home/announce/trends/96673
下载链接
链接失效反馈官方服务:
资源简介:
销售渗透率通常定义为特定产品在潜在市场中的占有率。对公司天猫平台上胸牌商品在不同地区的销售渗透率进行分析,对于理解胸牌商品在不同地区的市场发展趋势、识别商品在不同地区的增长机会和潜在风险、指导公司选品规划和商品定价以及优化资源配置,具有重要的统计意义和实际应用价值。本数据也可为胸牌商品的供应商(生产厂商)和其他销售商同行在市场进入、产品开发、定价策略等方面提供参考。1.数据收集和预处理:(1)数据收集:收集公司在天猫平台上销售的胸牌商品在不同地区每季度的销售统计信息,具体包括商品类目、商品名称、销售渠道/平台、统计区域、统计年份和季度、本季度内单月最高销量、本季度内单月最低销量、本季度平均月销量。(2)数据预处理:对采集到的原始数据进行处理,去除缺失和异常数据。
2.建立销售渗透率分析模型:(1)计算本季度月均潜在销量:本季度月均潜在销量=本季度内单月最高销量-本季度内单月最低销量+本季度平均月销量;(2)计算本季度月均销售渗透率:本季度月均销售渗透率=(本季度平均月销量/本季度月均潜在销量)*100%;(3)销售渗透率分析:基于计算出的销售渗透率,根据区县划分不同的类别和级别,≥90%以上标记为“销售渗透率高”,50%-90%区间(不含50%和90%)内标记为“销售渗透率中等”,≤50%标记为“销售渗透率低”。分界线90%和50%通过公司内部与行业专家研讨确定。
Sales penetration rate is generally defined as the share of a specific product in its potential market. Analyzing the sales penetration rate of the company's name badge products sold on the Tmall platform across different regions holds significant statistical significance and practical application value for understanding the market development trends of name badges in various regions, identifying growth opportunities and potential risks in different regions, guiding the company's product selection planning, product pricing, and optimized resource allocation. This dataset can also provide references for suppliers (manufacturers) of name badge products and other peer sellers in terms of market entry, product development, pricing strategies, and other aspects.
1. Data Collection and Preprocessing:
(1) Data Collection: Collect quarterly sales statistics of the company's name badge products sold on the Tmall platform across different regions, specifically including product category, product name, sales channel/platform, statistical region, statistical year and quarter, monthly highest sales volume in the quarter, monthly lowest sales volume in the quarter, and average monthly sales volume in the quarter.
(2) Data Preprocessing: Process the collected raw data by removing missing and abnormal data.
2. Establishment of Sales Penetration Rate Analysis Model:
(1) Calculate the monthly potential sales volume in the quarter: Monthly potential sales volume in the quarter = Monthly highest sales volume in the quarter - Monthly lowest sales volume in the quarter + Average monthly sales volume in the quarter;
(2) Calculate the monthly average sales penetration rate in the quarter: Monthly average sales penetration rate in the quarter = (Average monthly sales volume in the quarter / Monthly potential sales volume in the quarter) * 100%;
(3) Sales Penetration Rate Analysis: Based on the calculated sales penetration rate, classify and grade different regions by districts and counties. Regions with a rate ≥90% are marked as "High Sales Penetration", those in the 50%-90% interval (excluding 50% and 90%) are marked as "Medium Sales Penetration", and those with a rate ≤50% are marked as "Low Sales Penetration". The threshold values of 90% and 50% were determined through internal company discussions with industry experts.
提供机构:
宁波市松果信息技术服务有限公司
创建时间:
2024-10-22
搜集汇总
数据集介绍
以上内容由遇见数据集搜集并总结生成


