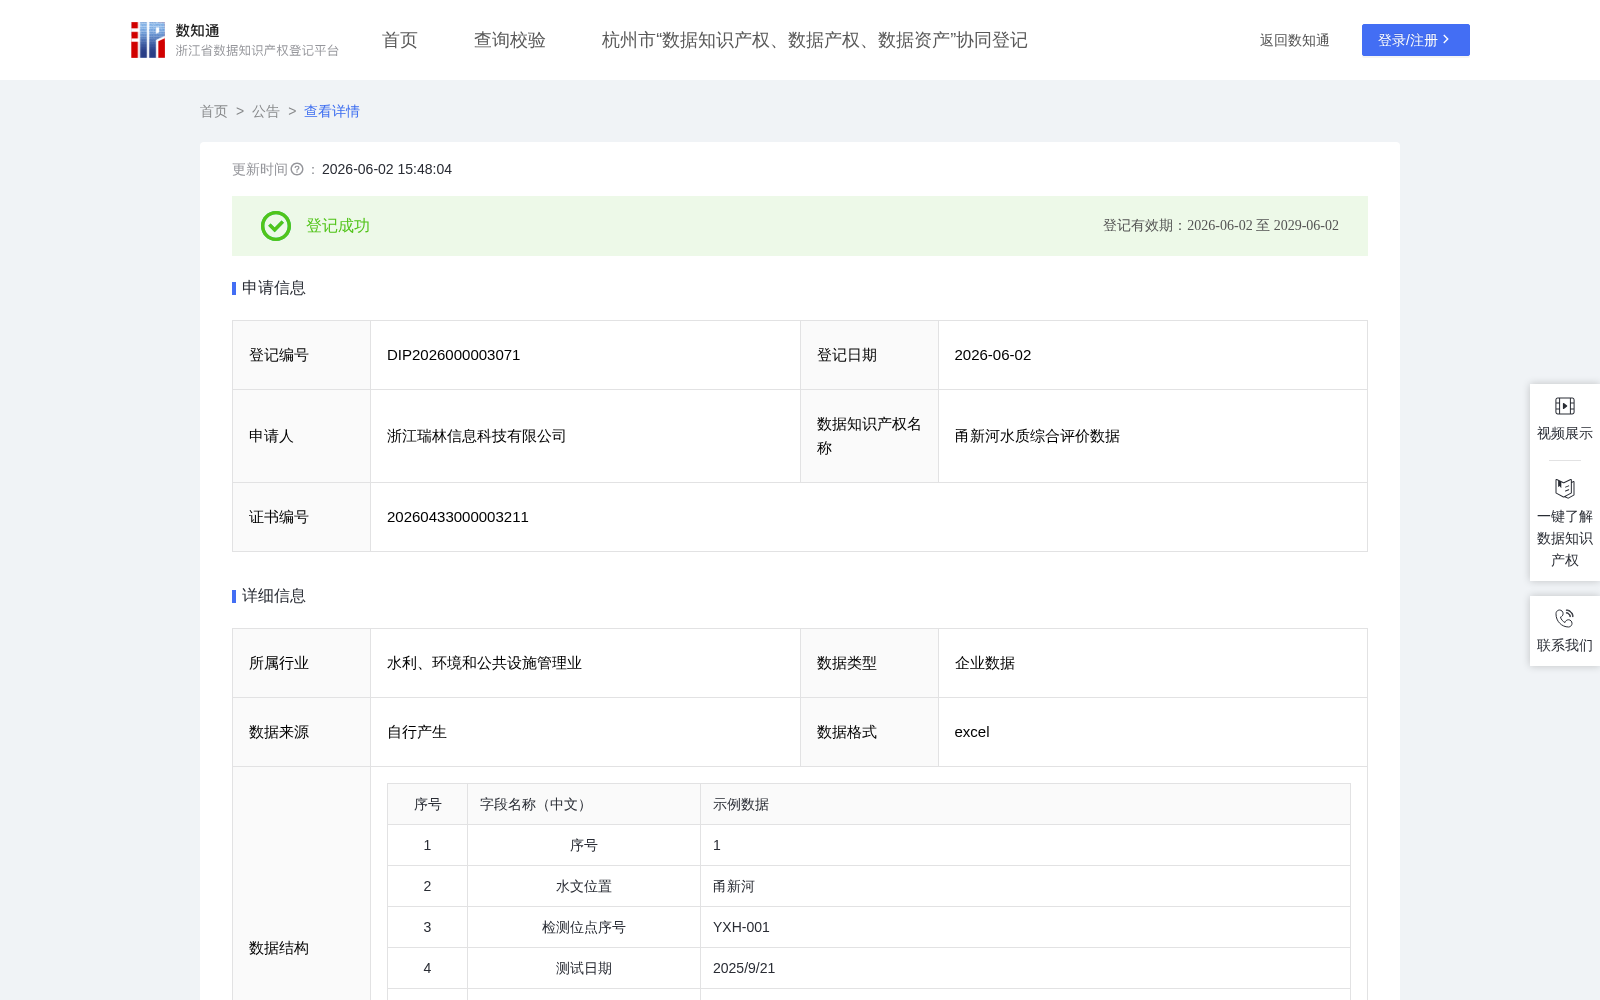
甬新河水质综合评价数据
收藏资源简介:
本数据通过对浙江省宁波市甬新河河水水样采集及检测,获取浊度、PH值、氨氮、总磷、重金属Pb含量、大肠杆菌数量、COD、溶解氧等水质指标,基于这些水质指标经过数学模型分析得到浙江省宁波市甬新河河水水质综合指数,根据水质综合指数数值即可对水质进行评价。本数据可作为相关职能部门制定水资源利用与保护的决策依据,具体可被生态环境部门用来支撑饮用水水源地保护与水环境功能区划实施,可被水利管理部门用来评估流域生态健康状况与水资源调控策略,可被城市管理部门用来优化用水安全预警与污染应急响应机制,也可被科研机构用来开展水质演变规律分析与评价模型验证等。1.数据采集。采集浙江省宁波市甬新河的河水进行浊度、PH值、氨氮、总磷、重金属Pb含量、大肠杆菌数量、COD、溶解氧检测,对检测数据进行清洗处理,确保数据的规范性、完整性和准确性。 2.算法规则。对浊度、PH值、氨氮、总磷、重金属Pb含量、大肠杆菌数量、COD、溶解氧这8个指标进行无量纲量化处理(记为Si),依据各指标的环境影响权重Wi进行加权求和,即可得到水质综合指数WQI,即水质综合指数WQI计算公式为WQI=∑(Si*Wi)。根据WQI数值将水质分为5个等级,以对水质进行综合评价。 各指标量化值Si的量化处理方法为:S(浊度)=实测值/10;S(pH)分段计算,当pH实测值<6.5时S(pH)=(7.0-实测值)/0.5,pH实测值在6.5~8.5时S(pH)=0,当pH实测值>8.5时S(pH)=(实测值-8.5)/0.5;S(氨氮)=实测值/1.0;S(总磷)=实测值/0.2;S(重金属Pb)分段计算,当实测值≤0.05时S(重金属Pb)=实测值/0.05,当实测值>0.05时S(重金属Pb)=10;S(大肠杆菌)分段计算,当实测值≤1000时S(大肠杆菌)=实测值/1000,当实测值>1000时S(大肠杆菌)=10;S(COD)=实测值/20;S(溶解氧)分段计算,当实测值<5时S溶解氧)=10-实测值*1.8,当实测值≥5时S(溶解氧)=0。 各指标权重Wi分别为:W(浊度)=0.09;W(pH)=0.11;W(氨氮)=0.16;W(总磷)=0.13;W(重金属Pb)=0.13;W(大肠杆菌)=0.13;W(COD)=0.11;W(溶解氧)=0.14。 水质综合指数WQI分级标准为:0.00~0.50优;0.51~1.00良;1.01~2.00中;2.01~3.00差;>3.00劣。
This dataset is obtained by collecting and testing water samples from the Yongxin River in Ningbo City, Zhejiang Province. A series of water quality indicators including turbidity, pH value, ammonia nitrogen, total phosphorus, heavy metal Pb concentration, E. coli count, Chemical Oxygen Demand (COD) and dissolved oxygen are collected. Based on these indicators, the Water Quality Index (WQI) of the Yongxin River water is calculated via mathematical model analysis, which can be used to evaluate the water quality. This dataset can serve as a decision-making basis for relevant functional departments to formulate water resource utilization and protection policies. Specifically, it can be used by ecological environment departments to support the protection of drinking water source areas and the implementation of water environment functional zoning; by water management departments to assess basin ecological health and water resource regulation strategies; by urban management departments to optimize water safety early warning and pollution emergency response mechanisms; and by research institutions to conduct water quality evolution law analysis and evaluation model verification, etc. 1. Data Collection Water samples from the Yongxin River in Ningbo City, Zhejiang Province are collected for testing of the 8 aforementioned water quality indicators. The test data are cleaned to ensure their standardization, completeness and accuracy. 2. Algorithm Rules The 8 aforementioned water quality indicators are subjected to dimensionless quantification (denoted as $S_i$). The Water Quality Index (WQI) is obtained by weighted summation based on the environmental impact weight $W_i$ of each indicator. The calculation formula of WQI is $WQI = sum(S_i imes W_i)$. The water quality is divided into 5 grades based on the WQI value for comprehensive water quality evaluation. The quantification methods for each indicator's $S_i$ value are as follows: $S$(turbidity) = measured value / 10; $S$(pH) is calculated in segments: when the measured pH value < 6.5, $S$(pH) = (7.0 - measured value) / 0.5; when the measured pH value is between 6.5 and 8.5, $S$(pH) = 0; when the measured pH value > 8.5, $S$(pH) = (measured value - 8.5) / 0.5; $S$(ammonia nitrogen) = measured value / 1.0; $S$(total phosphorus) = measured value / 0.2; $S$(heavy metal Pb) is calculated in segments: when the measured value ≤ 0.05, $S$(heavy metal Pb) = measured value / 0.05; when the measured value > 0.05, $S$(heavy metal Pb) = 10; $S$(E. coli) is calculated in segments: when the measured value ≤ 1000, $S$(E. coli) = measured value / 1000; when the measured value > 1000, $S$(E. coli) = 10; $S$(COD) = measured value / 20; $S$(dissolved oxygen) is calculated in segments: when the measured value < 5, $S$(dissolved oxygen) = 10 - measured value × 1.8; when the measured value ≥ 5, $S$(dissolved oxygen) = 0. The weight $W_i$ of each indicator is as follows: $W$(turbidity) = 0.09; $W$(pH) = 0.11; $W$(ammonia nitrogen) = 0.16; $W$(total phosphorus) = 0.13; $W$(heavy metal Pb) = 0.13; $W$(E. coli) = 0.13; $W$(COD) = 0.11; $W$(dissolved oxygen) = 0.14. The grading standard for WQI is: 0.00~0.50: Excellent; 0.51~1.00: Good; 1.01~2.00: Medium; 2.01~3.00: Poor; >3.00: Severe.