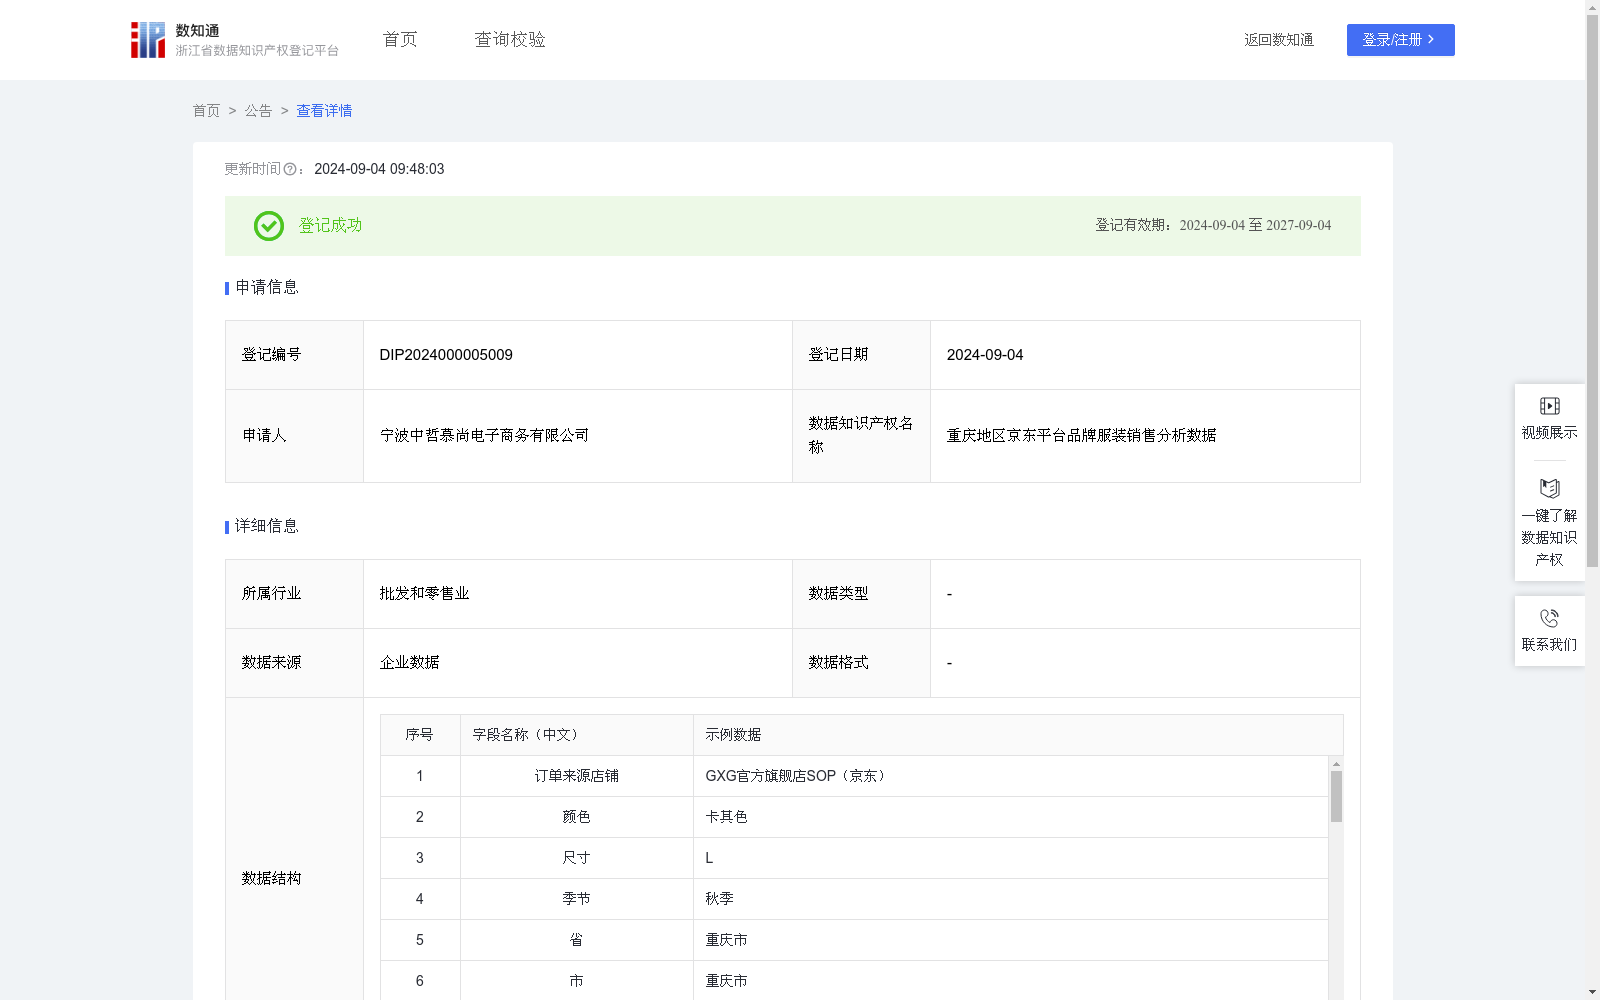
重庆地区京东平台品牌服装销售分析数据
收藏浙江省数据知识产权登记平台2024-09-04 更新2024-09-05 收录
下载链接:
https://www.zjip.org.cn/home/announce/trends/57642
下载链接
链接失效反馈官方服务:
资源简介:
通过平台调取品牌店铺在重庆地区商品销售数据,可评估该地区不同季节不同产品销售情况,并通过客户颜色偏好度、各尺寸占比数据判断,了解客户喜好和该区域客户群体尺寸的分布情况,优化营销计划,实现生产订单的合理安排和区域针对性前期铺货。数据收集:收集销售相关的数据,包括订单来源店铺、颜色、尺码、季节、省、市、区、品类等。
数据处理:对数据进行清洗、删除重复数据,处理缺失值,识别和处理异常值,确保数据的准确性和一致性。
数据分析:对数据进行统计分析,根据季节变化,统计重庆区域内每季产品销售量的top6,然后通过字段“颜色”、“尺寸”分别进行数据分析,对排名前6品类的颜色偏好度和尺寸比例分别进行统计,颜色偏好度=该品类该颜色订单量/该品类订单总量,尺寸比例=该品类该尺寸订单量/该品类订单总量。计算出该区域内各个季节,客户群体偏向的品类,该品类顾客颜色的偏好和尺寸的选择比例,通过自建模型,使用BI实现分析结果的可视化展示。
数据应用:将分析结果应用到运营场景中,帮助品牌店铺更好了解该区域内各季节客户的偏好和销售尺寸的选择,从而制定更精准的营销策略,指导企业合理安排生产和铺货。
By extracting sales data of brand stores in Chongqing via the platform, this dataset enables evaluation of product sales performance across different seasons in this region. By leveraging customer color preference and size proportion data, it helps understand customer preferences and the size distribution of local customer groups, optimize marketing plans, and achieve reasonable arrangement of production orders as well as targeted regional pre-stocking.
Data Collection: Sales-related data is collected, including order source store, color, size, season, province, city, district, product category and other relevant fields.
Data Processing: Data cleaning is conducted, including removing duplicate records, handling missing values, identifying and processing outliers, to ensure data accuracy and consistency.
Data Analysis: Statistical analysis is performed on the dataset. First, the top 6 best-selling product categories in Chongqing per season are counted based on seasonal variations. Then, separate analyses are carried out using the "color" and "size" fields. The color preference and size proportion of the top 6 product categories are calculated respectively, where color preference = order volume of a specific color for a given category / total order volume of that category, and size proportion = order volume of a specific size for a given category / total order volume of that category. Through these calculations, the customer-preferred product categories, their color preferences and size selection proportions for each season in this region are derived. Finally, the analysis results are visualized using BI with a self-built model.
Data Application: The analysis results are applied to operational scenarios, helping brand stores better understand customer preferences and size selection trends across seasons in this region, thereby formulating more precise marketing strategies and guiding enterprises to reasonably arrange production and regional stock distribution.
提供机构:
宁波中哲慕尚电子商务有限公司
创建时间:
2024-08-05
搜集汇总
数据集介绍
以上内容由遇见数据集搜集并总结生成


