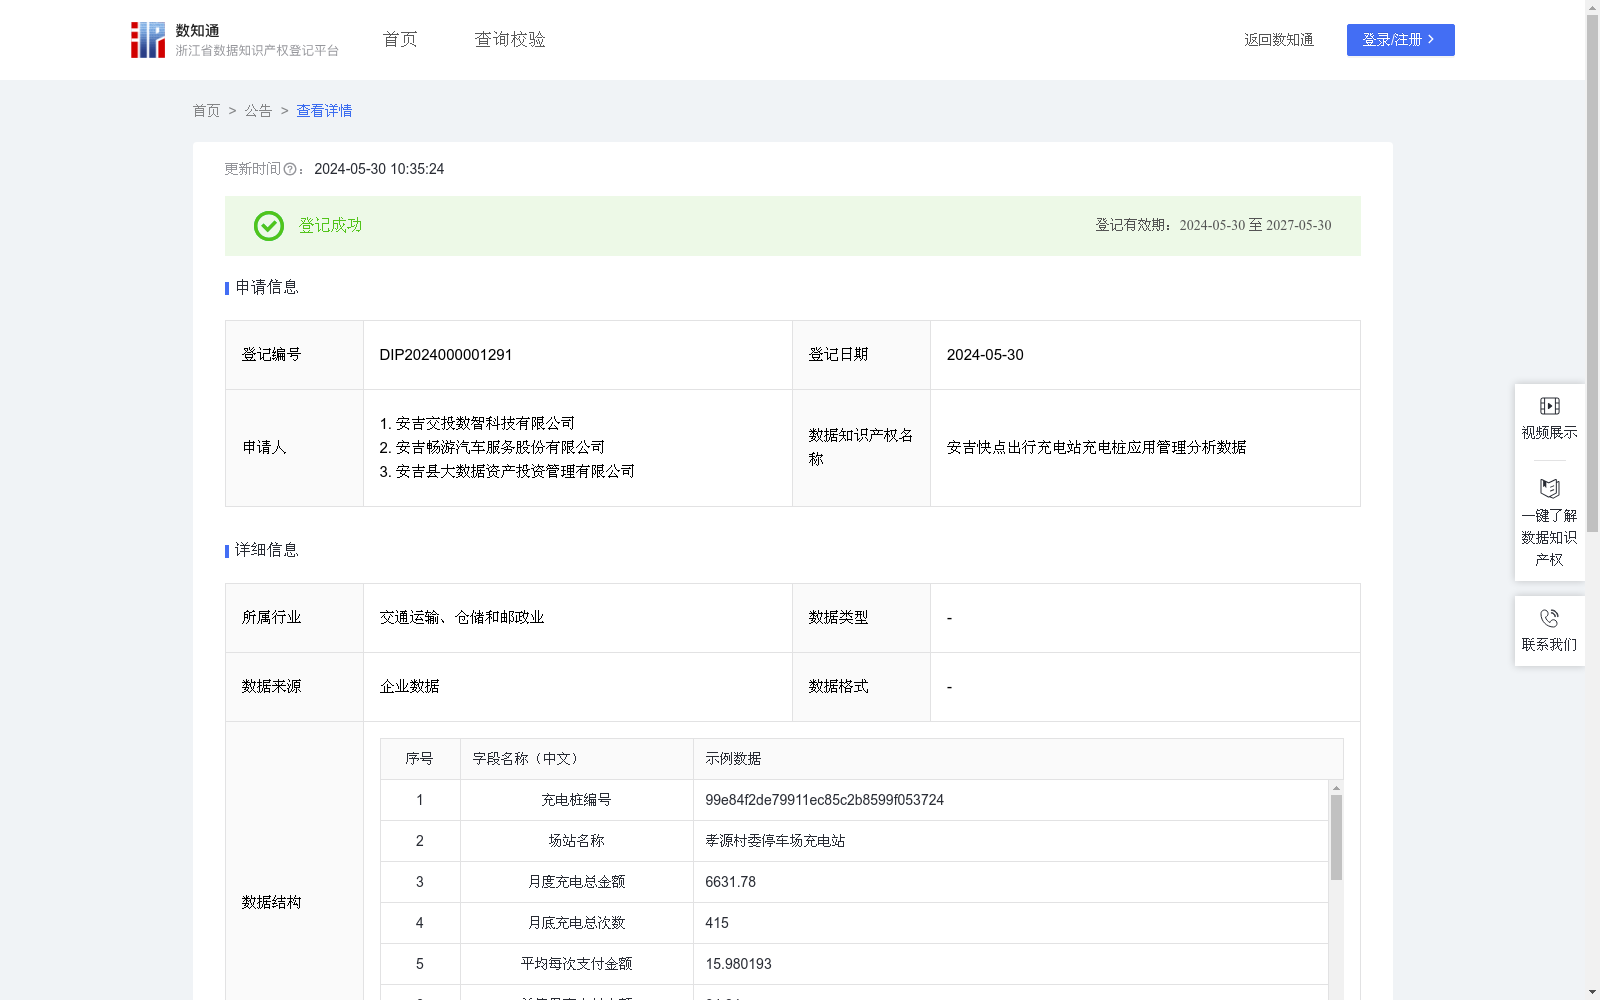
安吉快点出行充电站充电桩应用管理分析数据
收藏浙江省数据知识产权登记平台2024-05-30 更新2024-06-01 收录
下载链接:
https://www.zjip.org.cn/home/announce/trends/33664
下载链接
链接失效反馈官方服务:
资源简介:
通过收集的充电桩充电场站的数据,包括充电总度数、充电总金额、充电次数、单次最高与最低支付金额、服务费总额以及低额充电次数,能够全面分析充电桩的使用频率、用户支付行为和收益情况。通过数据分析在运营效率上进行优化,通过评估充电次数和度数,企业可以识别并调整高负荷或低负荷的充电桩及场站,提升资源配置的效率。同时,充电总金额和服务费总额为企业提供直接的财务反馈,支持财务规划和投资决策。此外,用户支付金额分布数据有助于企业调整定价策略,以满足不同用户群体的需求,增强市场竞争力。深入分析用户支付数据可揭示消费习惯和偏好,为个性化服务和用户体验的提升提供支持。结合历史数据和市场趋势的分析,企业能够预测充电需求,为长期战略规划和资源配置提供数据支持。此外,共享这些数据还能加强与电力供应商、汽车制造商等行业伙伴的合作关系,共同开发新商业模式,创造更多附加值;推动行业标准制定和技术创新,从而提升行业影响力。综合利用这些数据,企业不仅能够提升自身的运营和财务表现,还能深化对用户需求的理解,预测市场趋势,并在新能源汽车行业中发挥引领作用,推动整个行业的发展。步骤1:通过评率、效率计算指标得分1.使用频率:充电次数/充电桩总数(充电桩编号计数总数)2.收入效率:充电总金额/充电桩总数3.服务效率:服务费总额/充电总金额4.用户支付分布:(单次最高支付金额-单次最低支付金额)/充电次数5.低消费使用比例:充电金额少于三元的充电次数/总充电次数6.使用频率得分=使用频率*100; 7.收入效率得分=收入效率8.服务效率得分=服务效率*100;9.用户支付得分=1/(用户支付分布+10)*100; 10.低消费使用得分=(1-低消费使用比例)*100; 步骤2:为每个指标分配权重 使用频率权重:0.2;收入效率权重:0.3;服务效率权重:0.1;用户支付分布权重:0.3;低消费使用比例权重:0.1;权重合计值为1 步骤3:计算综合得分 综合得分=(使用频率得分*权重1)+(收入效率得分*权重2)+(服务效率得分*权重3)+(用户支付分布得分*权重4)+(低消费使用比例得分*权重5) 步骤4:评价充电桩 根据综合得分,分为四个等级:A:得分大于20分;B:得分15-20分之间C:得分10-15分之间D:得分小于10分
This dataset is collected from electric vehicle (EV) charging station data, including total charging kWh, total charging amount, number of charging sessions, maximum and minimum single-session payment amounts, total service fees, and number of low-value charging sessions. It can comprehensively analyze the usage frequency of charging piles, user payment behaviors and revenue situations.
By optimizing operational efficiency through data analysis, enterprises can identify and adjust overloaded or underloaded charging piles and stations by evaluating the number of charging sessions and energy consumption, thereby improving resource allocation efficiency.
Meanwhile, total charging amount and total service fees provide enterprises with direct financial feedback, supporting financial planning and investment decisions.
In addition, data on the distribution of user payment amounts can help enterprises adjust pricing strategies to meet the needs of different user groups and enhance market competitiveness.
In-depth analysis of user payment data can reveal consumption habits and preferences, providing support for personalized services and improvement of user experience.
By combining historical data and market trend analysis, enterprises can predict charging demand and provide data support for long-term strategic planning and resource allocation.
Furthermore, sharing such data can strengthen cooperative relationships with industry partners such as power suppliers and automobile manufacturers, jointly develop new business models and create more added value; promote the formulation of industry standards and technological innovation, thereby enhancing industry influence.
By comprehensively utilizing these data, enterprises can not only improve their own operational and financial performance, but also deepen their understanding of user needs, predict market trends, play a leading role in the new energy vehicle industry and promote the development of the entire industry.
Step 1: Calculate indicator scores via usage rate and efficiency
1. Usage frequency: Number of charging sessions / Total number of charging piles (total count of charging pile IDs)
2. Revenue efficiency: Total charging amount / Total number of charging piles
3. Service efficiency: Total service fees / Total charging amount
4. User payment distribution: (Maximum single-session payment amount - Minimum single-session payment amount) / Number of charging sessions
5. Low-value consumption usage ratio: Number of charging sessions with charging amount less than 3 yuan / Total number of charging sessions
6. Usage frequency score = Usage frequency * 100
7. Revenue efficiency score = Revenue efficiency
8. Service efficiency score = Service efficiency * 100
9. User payment score = 1 / (User payment distribution + 10) * 100
10. Low-value consumption usage score = (1 - Low-value consumption usage ratio) * 100
Step 2: Assign weights to each indicator
Weight of usage frequency: 0.2; Weight of revenue efficiency: 0.3; Weight of service efficiency: 0.1; Weight of user payment distribution: 0.3; Weight of low-value consumption usage ratio: 0.1; The total sum of weights equals 1.
Step 3: Calculate the comprehensive score
Comprehensive score = (Usage frequency score * Weight 1) + (Revenue efficiency score * Weight 2) + (Service efficiency score * Weight 3) + (User payment distribution score * Weight 4) + (Low-value consumption usage ratio score * Weight 5)
Step 4: Evaluate charging piles
Based on the comprehensive score, it is divided into four levels:
A: Score greater than 20;
B: Score between 15 and 20;
C: Score between 10 and 15;
D: Score less than 10.
提供机构:
安吉交投数智科技有限公司,安吉畅游汽车服务股份有限公司,安吉县大数据资产投资管理有限公司
创建时间:
2024-05-13
搜集汇总
数据集介绍
特点
该数据集包含645条充电桩的使用数据,涵盖充电次数、支付金额、服务费等关键指标,每季度更新一次。通过分析这些数据,企业可以优化充电桩的运营效率、调整定价策略,并预测市场趋势,提升整体竞争力。
以上内容由遇见数据集搜集并总结生成


