electricsheepeurope/europe-ilo-ged-xlu3-sex-hht-geo-rt-prime-age-combined-rate-of-unemployment-and-potent
收藏资源简介:
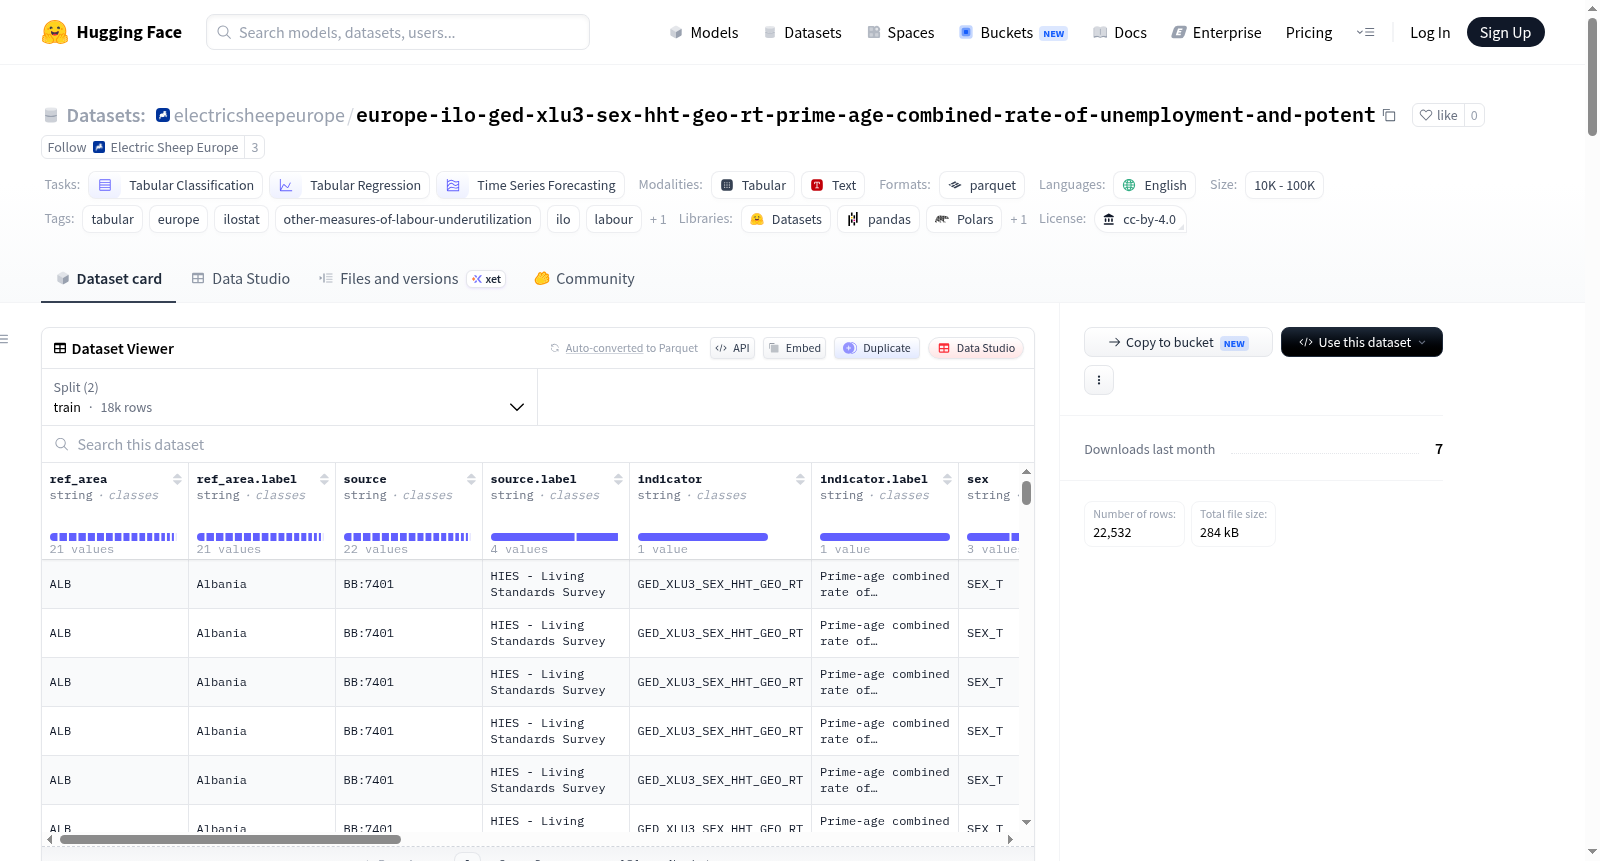
--- license: cc-by-4.0 language: - en task_categories: - tabular-classification - tabular-regression - time-series-forecasting multilinguality: monolingual size_categories: - 10K<n<100K tags: - tabular - europe - ilostat - other-measures-of-labour-underutilization - ilo - labour - employment pretty_name: "Prime-age combined rate of unemployment and potential labour force (LU3) by sex, household | Europe (ILOSTAT)" --- # Prime-age combined rate of unemployment and potential labour force (LU3) by sex, household | Europe (ILOSTAT) 🇪🇺 **22,532 observations** · **27 Europe countries** · **2000–2024** · *Repackaged by [Electric Sheep Europe](https://huggingface.co/electricsheepeurope)*      ## TL;DR This dataset contains **22,532 observations** of `Other measures of labour underutilization` data across **27 Europe countries**, spanning **2000–2024**, covering **1 distinct indicators**. ## About the source **ILOSTAT** is the ILO's central statistics database, the leading global source for labour statistics. It compiles indicators across employment, unemployment, wages, working time, child labour, informal economy, social protection, occupational injuries, and SDG decent work targets — drawing on national labour force surveys, household income surveys, establishment surveys, and administrative records. Coverage spans 200+ economies, with the ILO's Department of Statistics responsible for harmonisation. - **Source:** [ILOSTAT](https://www.ilo.org/shinyapps/bulkexplorer/?id=GED_XLU3_SEX_HHT_GEO_RT) - **Publisher:** International Labour Organization (ILO) - **License:** [cc-by-4.0](https://creativecommons.org/licenses/by/4.0/) - **Topic:** Other measures of labour underutilization ## Methodology Data pulled directly from the ILOSTAT REST API at `https://rplumber.ilo.org/data/indicator?id=GED_XLU3_SEX_HHT_GEO_RT` and filtered to Europe ISO3 country codes. ILOSTAT harmonises raw survey microdata using ICLS (International Conference of Labour Statisticians) definitions; sources are flagged in the `source.label` column for traceability. ## Geographic coverage 27 Europe countries · top rows shown below, sorted by row count: | Country | Rows | First year | Last year | |---------|-----:|-----------:|----------:| | `ESP` | 1,296 | 2000 | 2023 | | `DEU` | 1,295 | 2000 | 2023 | | `AUT` | 1,294 | 2000 | 2023 | | `BEL` | 1,286 | 2000 | 2023 | | `HUN` | 1,242 | 2001 | 2023 | | `LVA` | 1,233 | 2001 | 2023 | | `EST` | 1,199 | 2000 | 2023 | | `LTU` | 1,184 | 2002 | 2023 | | `GRC` | 1,103 | 2001 | 2024 | | `NLD` | 1,092 | 2000 | 2020 | | `GBR` | 1,076 | 2000 | 2019 | | `HRV` | 1,057 | 2002 | 2023 | | `POL` | 1,025 | 2006 | 2024 | | `SVN` | 1,015 | 2005 | 2023 | | `IRL` | 970 | 2006 | 2023 | | ... | _12 more countries_ | | | ## Indicators (sample) - `GED_XLU3_SEX_HHT_GEO_RT` — Prime-age combined rate of unemployment and potential labour force (LU3) by sex, household type and rural / urban areas (%) ## Schema | Column | Type | Description | Example | |--------|------|-------------|---------| | `ref_area` | `string` | ISO 3166-1 alpha-3 country code | `ALB` | | `ref_area.label` | `string` | Country name in English | `Albania` | | `source` | `string` | ILOSTAT source code (e.g. labour force survey) | `BB:7401` | | `source.label` | `string` | Source name in English | `HIES - Living Standards Survey` | | `indicator` | `string` | ILOSTAT indicator code | `GED_XLU3_SEX_HHT_GEO_RT` | | `indicator.label` | `string` | Indicator name in English | `Prime-age combined rate of unemployme…` | | `sex` | `string` | Disaggregation by sex (SEX_T = total, SEX_M = male, SEX_F = female) | `SEX_T` | | `sex.label` | `string` | — | `Total` | | `classif1` | `string` | First classification variable (age, education, status, etc.) | `HHT_AGGREGATE_TOTAL` | | `classif1.label` | `string` | — | `Household type: Total` | | `classif2` | `string` | Second classification variable where applicable | `GEO_COV_NAT` | | `classif2.label` | `string` | — | `Area type: National` | | `time` | `int64` | Observation year | `2012` | | `obs_value` | `float64` | Observed indicator value (unit varies — see indicator definition) | `26.631` | | `obs_status` | `string` | Observation status flag (e.g. provisional, unreliable) | `U` | | `obs_status.label` | `string` | — | `Unreliable` | | `note_source` | `string` | — | `R1:3513` | | `note_source.label` | `string` | — | `Repository: ILO-STATISTICS - Micro da…` | ## Disaggregation dimensions The following columns provide disaggregation dimensions: - **`sex`** (3 unique values): `SEX_T`, `SEX_M`, `SEX_F` ## Data quality & caveats - Data is annual frequency. Some indicators also publish monthly or quarterly series — those are not included here. - When an indicator has multiple sources for the same country×year, the ILO-selected 'best source' is used. - Disaggregation columns (`sex`, `classif1`, `classif2`) are non-null only when the indicator publishes that breakdown. ## Usage ```python from datasets import load_dataset ds = load_dataset("electricsheepeurope/europe-ilo-ged-xlu3-sex-hht-geo-rt-prime-age-combined-rate-of-unemployment-and-potent") df = ds["train"].to_pandas() print(df.head()) ``` ### Filter to one country ```python germany = df[df["ref_area"] == "DEU"] ``` ### Time-series for a single indicator ```python sample = (df[df["indicator"] == "GED_XLU3_SEX_HHT_GEO_RT"] .sort_values("time")) sample.plot(x="time", y="obs_value", title="GED_XLU3_SEX_HHT_GEO_RT") ``` ### Pivot to country × year matrix ```python matrix = (df[df["indicator"] == "GED_XLU3_SEX_HHT_GEO_RT"] .pivot_table(index="time", columns="ref_area", values="obs_value")) print(matrix.tail()) ``` ## Citation ```bibtex @misc{europe_ilo_ged_xlu3_sex_hht_geo_rt_prime_age_combined_rate_of_unemployment_and_potent_2024, title = {Prime-age combined rate of unemployment and potential labour force (LU3) by sex, household | Europe (ILOSTAT)}, author = {International Labour Organization (ILO)}, year = {2024}, url = {https://www.ilo.org/shinyapps/bulkexplorer/?id=GED_XLU3_SEX_HHT_GEO_RT}, publisher = {HuggingFace Datasets, repackaged by Electric Sheep Europe}, howpublished = {\url{https://huggingface.co/datasets/electricsheepeurope/europe-ilo-ged-xlu3-sex-hht-geo-rt-prime-age-combined-rate-of-unemployment-and-potent}} } ``` ## License Released under [cc-by-4.0](https://creativecommons.org/licenses/by/4.0/). Original data © International Labour Organization (ILO). When using this dataset, please cite both the original source above and the Electric Sheep Europe repackaging. ## About Electric Sheep Electric Sheep Europe is part of the Electric Sheep mission: a unified, ML-ready data layer for Europe on HuggingFace. We pull data from authoritative open sources, normalize the schemas, package as Parquet, and publish with consistent dataset cards so researchers and developers can use `load_dataset()` to start working in seconds. Browse the full collection: [huggingface.co/electricsheepeurope](https://huggingface.co/electricsheepeurope) --- _Provenance: ingested 2026-05-27 via the Electric Sheep pipeline. Source URL: https://www.ilo.org/shinyapps/bulkexplorer/?id=GED_XLU3_SEX_HHT_GEO_RT_
This dataset is a tabular dataset focusing on labor market conditions in European countries, specifically under the category Other measures of labour underutilization. It contains 22,532 observations across 27 European countries, spanning from 2000 to 2024. The key indicator is Prime-age combined rate of unemployment and potential labour force (LU3) by sex, household type and rural / urban areas (%), which measures the combined rate of unemployment and potential labor force for prime-age individuals, disaggregated by sex, household type, and rural/urban areas. The data is sourced from the International Labour Organization (ILO) ILOSTAT database, retrieved via its REST API and filtered to European ISO3 country codes. The dataset includes a detailed schema with columns such as country code, country name, source code, indicator code, sex disaggregation, household type classification, area type classification, observation year, observed value, and observation status. It is suitable for tasks like tabular classification, regression, and time-series forecasting. The data is published at an annual frequency and comes with caveats on data quality, such as the use of ILO-selected best sources and handling of missing values in disaggregation columns.