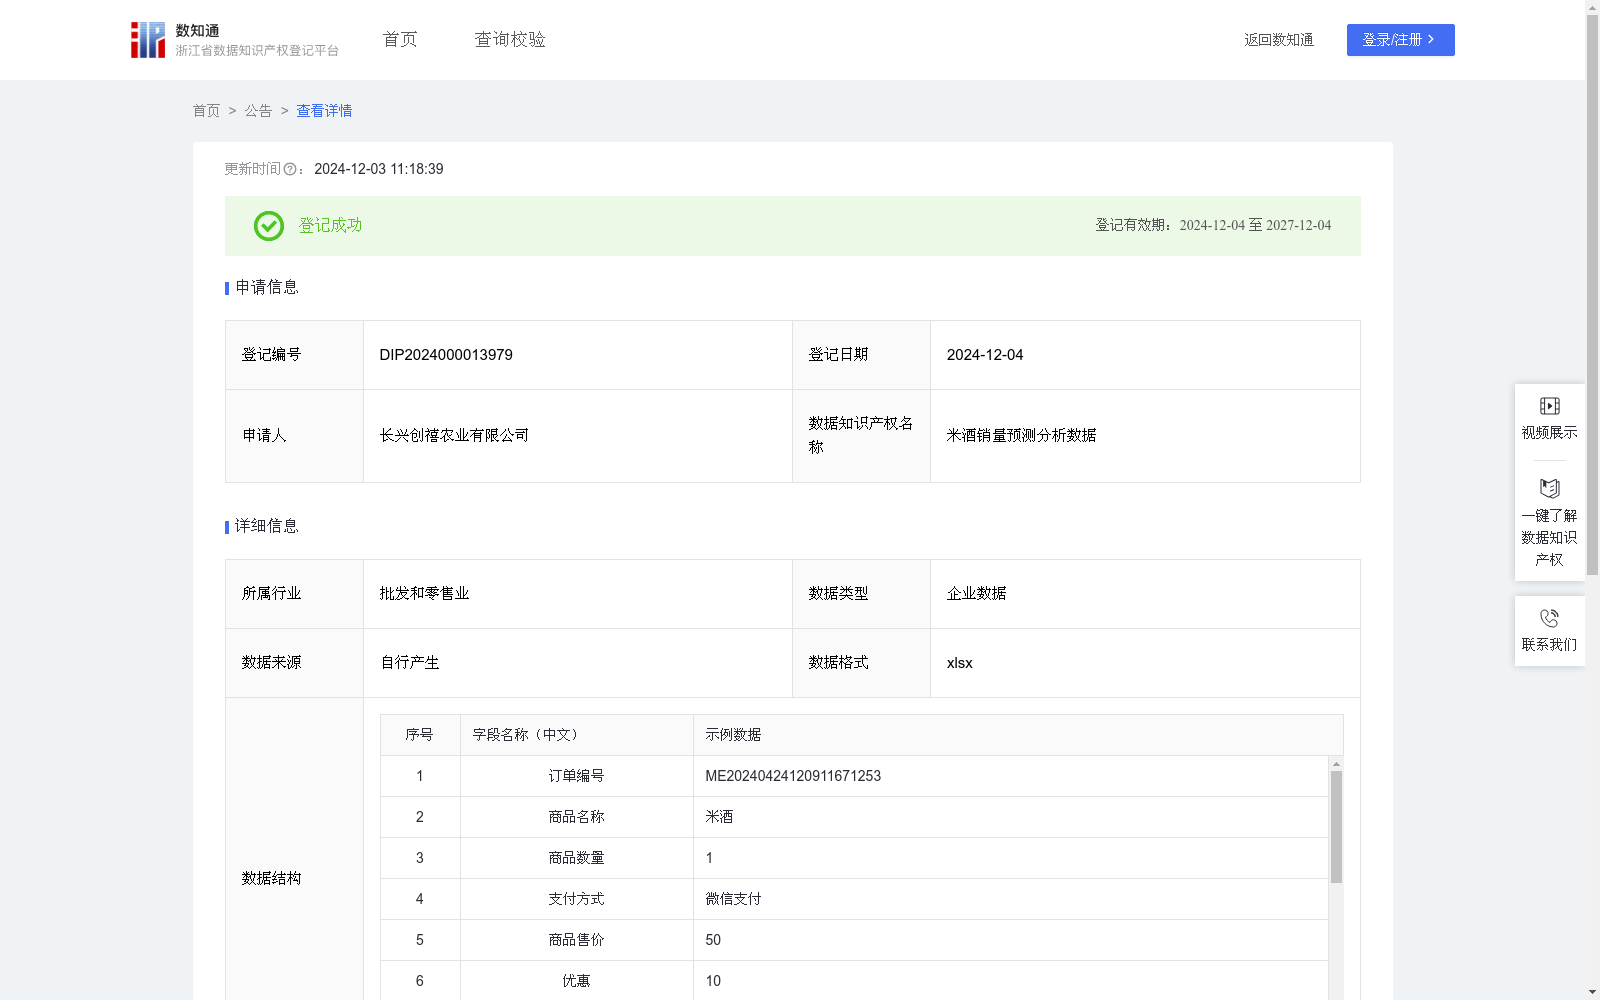
米酒销量预测分析数据
收藏浙江省数据知识产权登记平台2024-12-03 更新2024-12-04 收录
下载链接:
https://www.zjip.org.cn/home/announce/trends/93748
下载链接
链接失效反馈官方服务:
资源简介:
本数据的应用场景包括:(1)生产计划与库存管理:通过参考销量预测数据,米酒的制造商可以更精确地规划生产活动,避免过量生产导致的库存积压或生产不足导致的缺货情况,销售商根据预测情况进行合理备货。(2)市场策略制定:销量预测数据可以帮助米酒销售企业了解市场趋势和客户需求,从而制定更有效的市场策略,包括定价策略、促销活动和新产品推广策略等。(3)供应链优化:准确的销量预测能够帮助米酒生产企业优化供应链管理,包括原材料采购、生产进度控制和物流安排。(4)风险管理:在不确定的市场环境中,准确的销量预测能够帮助米酒生产企业识别潜在的市场风险,并采取相应的风险管理措施,如调整生产计划或采取对冲策略等。1.数据采集:采集公司的销售和订单信息以及后台库存信息。2.数据处理:对采集到的原始数据进行处理,去除缺失和异常数据,并根据时间和产品进行汇总。 3.数据分析:采用加权移动平均法预测销量,预测销量S=(S1*k1+S2*k2+S3*k3)/(k1+k2+k3),S1:本月的销量,S2:上月的销量,S3:上上月的销量,k1、k2、k3为权重系数,根据S1、S2和S3对下月销量预测值的影响程度确定,分别为4.5、3.5、2,本数据样例中S1为2024年4月的销量,S2为2024年3月的销量,S3为2024年2月的销量,S为5月的预测销量。库存健康监测P=实际库存/预测销量,P<1.5,“库存不足”,1.5≤P≤2.5,“库存健康”,P>2.5“库存积压”。4.数据应用:通过销量的预测,可以帮助企业提前合理预测销量,库存应该备货多少,若库存不足,则发出预警信号,需要及时考虑补货,若库存积压,则需要推出活动及时清理库存。
Application scenarios of this dataset include:
1. Production Planning and Inventory Management: By referring to sales forecast data, rice wine manufacturers can plan production activities more accurately, avoiding overproduction leading to inventory backlog or underproduction leading to stockouts, while sellers can reasonably prepare stock based on the forecast results.
2. Market Strategy Formulation: Sales forecast data can help rice wine sales enterprises understand market trends and customer demands, thereby formulating more effective marketing strategies, including pricing strategies, promotional activities and new product promotion strategies, etc.
3. Supply Chain Optimization: Accurate sales forecasts can help rice wine production enterprises optimize supply chain management, including raw material procurement, production schedule control and logistics arrangement.
4. Risk Management: In an uncertain market environment, accurate sales forecasts can help rice wine production enterprises identify potential market risks and take corresponding risk management measures, such as adjusting production plans or adopting hedging strategies, etc.
1. Data Collection: Collect the company's sales and order information as well as background inventory information.
2. Data Processing: Process the collected raw data, remove missing and abnormal data, and aggregate the data according to time and product categories.
3. Data Analysis: The weighted moving average method is adopted to forecast sales volume, and the formula for forecasted sales S is S = (S1*k1 + S2*k2 + S3*k3)/(k1 + k2 + k3), where S1 represents the sales volume of the current month, S2 represents the sales volume of the previous month, S3 represents the sales volume of the month before last, and k1, k2, k3 are weight coefficients determined based on their influence degrees on the next month's sales forecast, with values of 4.5, 3.5 and 2 respectively. In the sample of this dataset, S1 is the sales volume in April 2024, S2 is the sales volume in March 2024, S3 is the sales volume in February 2024, and S is the forecasted sales volume in May. For inventory health monitoring, the indicator P is calculated as P = actual inventory / forecasted sales volume. When P < 1.5, it is marked as "insufficient inventory"; when 1.5 ≤ P ≤ 2.5, it is marked as "healthy inventory"; when P > 2.5, it is marked as "inventory backlog".
4. Data Application: Through sales forecast, enterprises can reasonably predict sales volume in advance and determine the appropriate inventory stock level. If the inventory is insufficient, an early warning signal will be issued to prompt timely replenishment; if there is inventory backlog, promotional activities will be launched to clean up the excess inventory in a timely manner.
提供机构:
长兴创禧农业有限公司
创建时间:
2024-10-29
搜集汇总
数据集介绍
特点
该数据集为米酒销量预测分析数据,包含514条记录,每月更新,数据格式为xlsx。应用场景广泛,包括生产计划、市场策略、供应链优化和风险管理。数据通过加权移动平均法进行销量预测,并包含库存健康监测。
以上内容由遇见数据集搜集并总结生成


