
revanth7667/usa_opioid_overdose
收藏Hugging Face2024-03-19 更新2024-03-04 收录
下载链接:
https://hf-mirror.com/datasets/revanth7667/usa_opioid_overdose
下载链接
链接失效反馈官方服务:
资源简介:
---
license: mit
language:
- en
pretty_name: USA Opioid Overdose
size_categories:
- 10K<n<100K
dataset_info:
features:
- name: State
dtype: string
- name: State_Code
dtype: string
- name: County
dtype: string
- name: County_Code
dtype: string
- name: Year
dtype: int64
- name: Population
dtype: int64
- name: Deaths
dtype: int64
- name: Original
dtype: bool
- name: State_Mortality_Rate
dtype: float
- name: County_Mortality_Rate
dtype: float
---
## Overview
This dataset contains the number of yearly deaths due to **Unintentional** Drug Overdoses in the United States at a County Level between 2003-2015. To overcome the limitation of the original dataset, it is merged with population dataset to identify missing combinations and imputation is performed on the dataset taking into account the logical rules of the source dataset. Users can decide the proportion of the imputed values in the dataset by using the provided population and flag columns. Additional fields like state codes, FIPS codes are provided for the convenience of the user so that the dataset can be merged easily with other datasets.
## Data Structure
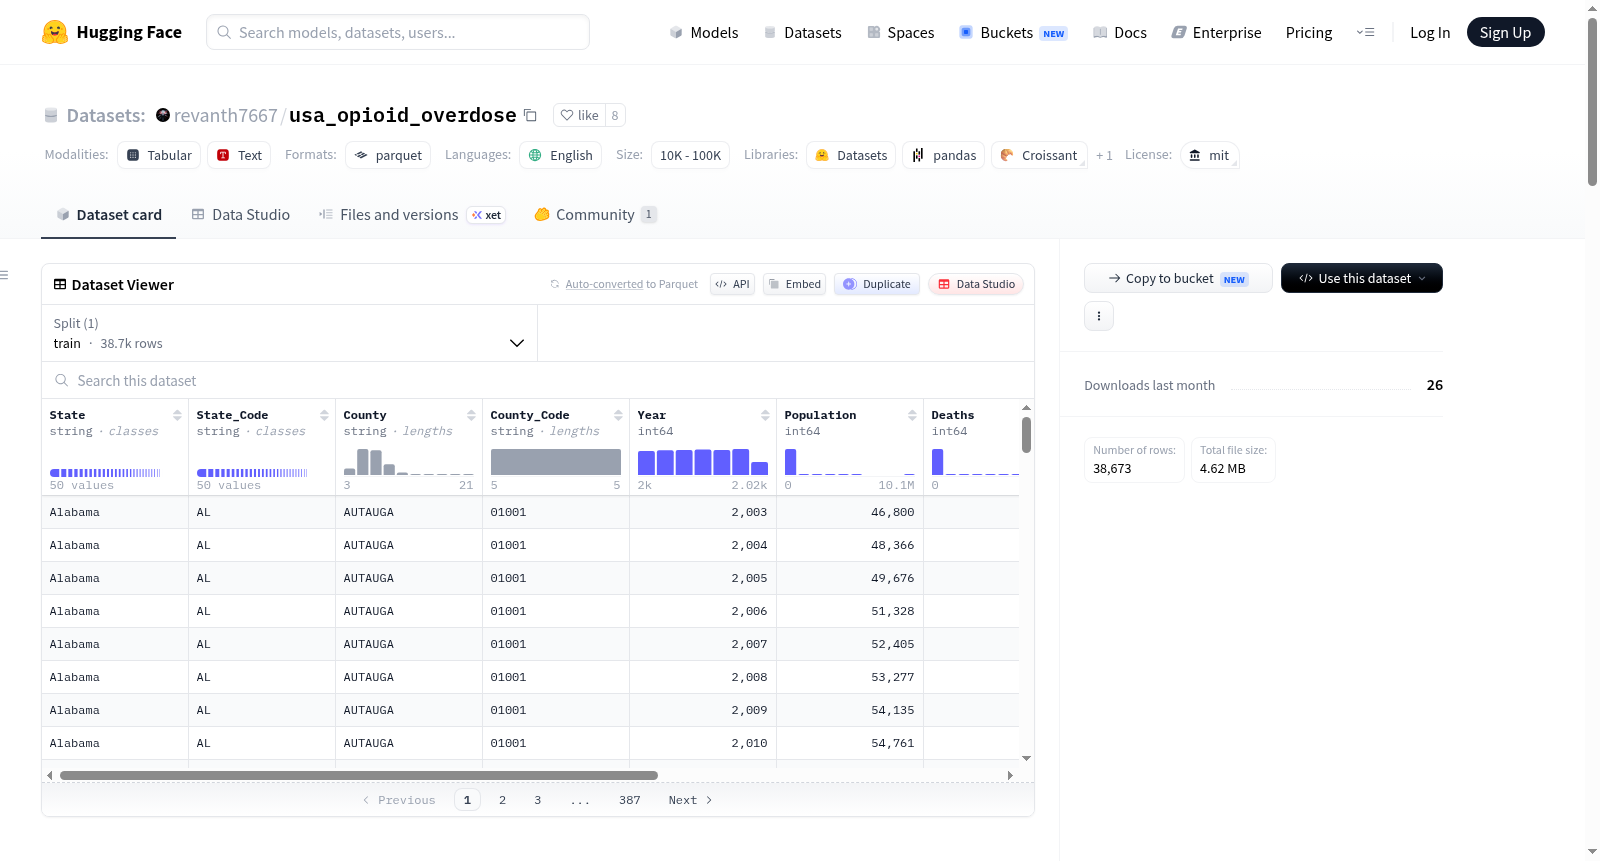
The dataset contains the following fields:
1. State (string): Name of the State
2. State_Code (string): 2 Character abbreviation of the state
3. County (string): Name of the County
4. County_Code (string): 5 Charter representation of the County’s FIPS code
5. Year (integer): Year
6. Population (integer): Population of the County for the given year
6. Deaths (integer): number of Drug overdose deaths in the county for the given year
7. Original (Boolean): To indicate if the Deaths are from original dataset or imputed
8. State_Mortality_Rate (float): Mortality rate of the state for the given year
9. County_Mortality_Rate (float): Mortality rate of the county for the given year
Notes:
1. County FIPS has been formatted as a string so that leading zeros are not lost and it is easier for the user to read it
2. The County_Mortality_Rate which is provided for convenience is calculated after the imputation of the missing values, hence it might not be accurate for all the combinations, refer the "Original" column to identify the imputed values.
## Data Source
1. Deaths Data: The original source of the data is the US Vital Statistics Agency [Link](https://www.cdc.gov/nchs/products/vsus.htm), however, for this project, it has been downloaded from a different [source](https://www.dropbox.com/s/kad4dwebr88l3ud/US_VitalStatistics.zip?dl=0) for convenience.
2. Population Data: To have consistency with the Mortality Data, the population Data has been downloaded from the [CDC Wonder](https://wonder.cdc.gov/bridged-race-v2020.html) portal. Population data is used for 2 purposes: to calculate the mortality rate and as a master list of Counties to perform the Imputation
3. Other Data: To provide convenience to the users of the Dataset, additional fields such as County Fips, State Codes etc. have been added so that users can easily combine it with other datasets if required. This mapping is a standard mapping which can be found on the internet.
The raw data files are present in the ``.01_Data/01_Raw`` folder for reference.
## Methodology
To study the impact of drug related deaths, one of the primary sources is the US Vital Statistics Agency. There is a limitation in the report since US Vital Statistics does not report the deaths in a county if the number of deaths in that county is less than 10 for privacy reasons. This means that the deaths available in the report are not fully representative of the deaths and hence any analysis performed on it may not be fully accurate. To overcome this, in this dataset, values are imputed for the missing counties based on State level mortality rates and population limiting factors. While this may not be 100% representative, it gives a slightly different and better approach to perform analysis on the drug related deaths.
Post the basic data cleaning and merging, the imputation is performed in the following steps:
1. Mortality Rate is calculated at the State-Year level using the available data
2. Master combination of State-County is obtained from Population file
3. For the missing counties a reverse calculation is performed using the state level mortality rate and the population of the county. A maximum calculated limit of 9 is imposed to preserve the conditions of the original data set.
4. Flag column is added to indicate if the values seen are original values or imputed ones
Since the original trend of the dataset may distort due to the imputations, the population data is left in the dataset and an additional column is added to the dataset to indicate if the values seen are from the original dataset or if they were imputed. Using the population and the flag column, the users of the dataset can decide the proportion of the imputed data in the analysis (This is the population limit factor).
The below graph shows the relation between the population limit factor and the % of imputed values in the dataset:

## Files and Folder Structure
1. Data Files: The raw data files are present in the [.01_Data/01_Raw](./.01_Data/01_Raw) folder for reference. The intermediate Population and Mortality files are present in the [.01_Data/02_Processed](./.01_Data/02_Processed) folder. The final dataset is present in the root folder.
The Data folder is hidden so that the raw and itermediate files are not loaded by the library.
2. Code Files: The code files are present in the [02_Code](./02_Code) folder.
- The "*_eda.ipynb" files are the exploratory files which the user can refer to understand the processing of the data in a step by step manner.
- The "*_script.py" files are the optimized scripts which contain only the required steps from the eda files to process the data.
provided the raw data files are present in the ``.01_Data/01_Raw`` folder, all the other intermediate and final data files can be generated using the script files provided in the ``02_Code`` folder.
## Disclaimers
1. This dataset has been created purely for educational purposes. The imputations performed is one of the many ways to handle the missing data, please consider the % of imputed data in the dataset before performing any analysis.
2. The Dataset does NOT contain data for Alaska since the original data for it is messsy, users can however make use of the raw files and modify the scripts if required to include Alaska
3. Only 1 type of drug related deaths is present in the dataset, refer to the master_eda file for details
4. Please refer to the original source of the data (links provided in the data source section) for any legal or privacy concerns.
提供机构:
revanth7667原始信息汇总
数据集概述
该数据集包含2003年至2015年间美国各县因非故意药物过量导致的年度死亡人数。为了克服原始数据集的限制,该数据集与人口数据集合并,以识别缺失的组合并进行插补。用户可以通过使用提供的“人口”和“原始”列来决定数据集中插补值的比例。此外,还提供了州代码、FIPS代码等字段,以便用户可以轻松地与其他数据集合并。
数据结构
数据集包含以下字段:
- State (字符串): 州名称
- State_Code (字符串): 州的2字符缩写
- County (字符串): 县名称
- County_Code (字符串): 县的5字符FIPS代码表示
- Year (整数): 年份
- Population (整数): 给定年份县的 population
- Deaths (整数): 给定年份县的药物过量死亡人数
- Original (布尔值): 指示死亡人数是来自原始数据集还是插补的
- State_Mortality_Rate (浮点数): 给定年份州的死亡率
- County_Mortality_Rate (浮点数): 给定年份县的死亡率
注意:
- 县的FIPS代码已格式化为字符串,以避免丢失前导零,并方便用户阅读。
- 提供的County_Mortality_Rate是在缺失值插补后计算的,因此对于所有组合可能不准确,请参考“Original”列以识别插补值。
数据来源
- 死亡数据: 原始数据来源是美国生命统计机构,但为了方便,该项目从其他来源下载。
- 人口数据: 为了与死亡数据保持一致,人口数据从CDC Wonder门户下载。人口数据用于计算死亡率和作为县的主列表进行插补。
- 其他数据: 为了方便用户,添加了如县FIPS、州代码等字段,以便用户可以轻松地与其他数据集合并。
方法论
为了研究药物相关死亡的影响,主要来源是美国生命统计机构。由于美国生命统计机构不会报告死亡人数少于10的县的死亡人数,因此报告中的死亡人数并不完全代表实际死亡人数。为了克服这一限制,在该数据集中,根据州级死亡率和人口限制因素对缺失的县进行插补。虽然这可能不完全代表实际情况,但它提供了一种不同的、更好的方法来分析药物相关死亡。
数据清洗和合并后,插补步骤如下:
- 使用可用数据计算州-年级别的死亡率
- 从人口文件中获取州-县的主组合
- 对于缺失的县,使用州级死亡率和县的人口进行反向计算,并施加最大计算限制9以保留原始数据集的条件
- 添加标志列以指示所见值是原始值还是插补值
由于插补可能会扭曲原始数据集的趋势,因此将人口数据保留在数据集中,并添加了一个额外的列以指示所见值是来自原始数据集还是插补的。用户可以使用人口和标志列来决定分析中插补数据的比例。
文件和文件夹结构
- 数据文件: 原始数据文件位于
.01_Data/01_Raw文件夹中。中间的人口和死亡率文件位于.01_Data/02_Processed文件夹中。最终数据集位于根文件夹中。 - 代码文件: 代码文件位于
02_Code文件夹中。*_eda.ipynb文件是探索性文件,用户可以参考以了解数据的逐步处理。*_script.py文件是优化脚本,仅包含处理数据所需的步骤。
搜集汇总
数据集介绍
构建方式
该数据集聚焦于美国县级层面非故意药物过量致死事件的年度统计,覆盖2003年至2015年。原始数据源于美国生命统计机构,但因隐私保护规则,当某县死亡人数低于10例时不予报告,导致数据存在缺失。为弥补这一局限,研究者基于州级死亡率与县级人口数据进行插补处理:首先计算州-年层面死亡率,随后从人口数据中提取完整的州-县组合,对缺失条目利用州级死亡率反向推算死亡数,并设定最大值为9以维持原始数据条件。最终,通过添加标记列区分原始值与插补值,并保留人口字段,以便用户根据分析需求灵活控制插补数据的比例。
特点
本数据集的核心特色在于其完整性增强与灵活性设计。通过系统性的插补策略,数据集填补了因隐私限制造成的空白,使得基于全县范围的药物过量死亡分析成为可能,相较于原始数据更具代表性。同时,数据集中包含州代码、FIPS代码等辅助字段,便于与其他数据集无缝融合。用户可借助“Original”布尔列和人口字段,自主决定插补数据在分析中的权重,从而在数据完整性与原始趋势保真度之间取得平衡。此外,数据集提供了州级和县级死亡率指标,为多层次流行病学探究提供了便利。
使用方法
数据集以结构化表格形式呈现,包含州、县、年份、人口、死亡数、死亡率和原始标记等十个字段,适用于时间序列分析、地理空间建模及公共卫生政策评估等场景。用户可直接加载根目录下的最终数据集文件,或通过提供的脚本从原始数据重新生成。推荐在分析前利用“Original”列筛选或加权处理,以控制插补数据的影响。数据集的代码文件夹内附有探索性分析笔记和优化脚本,方便用户复现构建流程或调整插补逻辑。由于数据不含阿拉斯加州,且仅涵盖非故意药物过量一种死因,使用时需注意这些局限性。
背景与挑战
背景概述
自21世纪初以来,美国阿片类药物滥用危机已成为公共卫生领域最严峻的挑战之一,每年导致数万人因药物过量死亡。为深入理解这一流行病的地域分布与时间演变趋势,revanth7667团队于近年创建了“usa_opioid_overdose”数据集,该数据集整合了2003年至2015年间美国县级非故意药物过量死亡数据,并融合人口统计信息以弥补原始资料的不足。其核心研究问题在于揭示县级层面药物过量死亡率的异质性,并评估数据缺失对分析结果的影响。该数据集由美国国家卫生统计中心的生命统计资料衍生而来,通过系统性的插补方法填补了因隐私限制而缺失的死亡记录,为流行病学、公共卫生政策及社会科学研究提供了宝贵的数据基础。其影响力在于,它不仅提升了县级死亡数据的完整性和可用性,还促使研究者关注数据质量对危机分析的影响,从而推动了更精准的干预策略制定。
当前挑战
该数据集面临的核心挑战源于原始数据的结构性缺陷:美国生命统计机构为避免泄露隐私,规定当县级死亡人数低于10例时不予报告,这导致约30%至50%的县级观察值缺失,严重扭曲了药物过量死亡的真实分布。为应对这一领域难题,数据集构建过程中采用了基于州级死亡率和县级人口的逆向插补法,但该方法引入了双重挑战:一是插补值可能低估或高估实际死亡数,尤其在人口稀少或死亡模式异常的县;二是插补后的死亡率计算存在偏差,需依赖“原始”标志字段供用户自行筛选数据。此外,数据整合还面临技术性障碍,如阿拉斯加州因原始数据混乱而被排除,且仅涵盖单一类型药物过量死亡,限制了跨州与多药物类别的比较分析。最终,用户需谨慎权衡插补数据比例与分析准确性,这增加了研究设计的复杂性。
常用场景
经典使用场景
在公共卫生与流行病学研究中,该数据集被广泛用于分析美国县级层面非故意药物过量死亡的时间趋势与空间分布。研究者借助其提供的年份、县人口、死亡数及死亡率等字段,能够构建纵向面板数据模型,探究阿片类药物危机在不同地域的演变规律。数据集中包含原始值与插补值的标识列,使得学者可以灵活调整插补数据比例,从而在保护隐私的前提下更完整地还原真实死亡格局,为政策干预效果的评估提供可靠基础。
实际应用
在实际应用中,该数据集为美国各州及地方的公共卫生决策提供了关键支撑。公共卫生机构可借助其死亡率与人口数据,识别阿片类药物过量高发县区,从而优化纳洛酮分发、治疗资源投放及预防宣传策略。此外,数据集简洁的结构与附加的FIPS编码便于与其他社会经济、医疗资源数据集融合,助力构建综合风险评估模型,实现从数据到行动的高效转化。
衍生相关工作
该数据集衍生了一系列经典工作,包括基于时空贝叶斯模型的县级死亡率平滑与预测研究,以及利用插补标志评估数据缺失对政策效果估计偏误的方法学探讨。部分工作进一步将其与处方药监测系统、失业率等外部数据结合,构建了多因素归因框架。此外,该数据集还启发了关于小区域估计技术的改进,推动了在隐私约束下提升公共卫生数据可用性的方法论创新,成为阿片类药物流行病学领域的重要基准资源。
以上内容由遇见数据集搜集并总结生成

暂无相关数据集


