青藏高原内流区冰川表面高程变化(1975-2020)
收藏国家青藏高原科学数据中心2022-10-24 更新2024-03-06 收录
下载链接:
https://data.tpdc.ac.cn/zh-hans/data/c2899572-c072-4008-ae89-8dd75dc69086
下载链接
链接失效反馈官方服务:
资源简介:
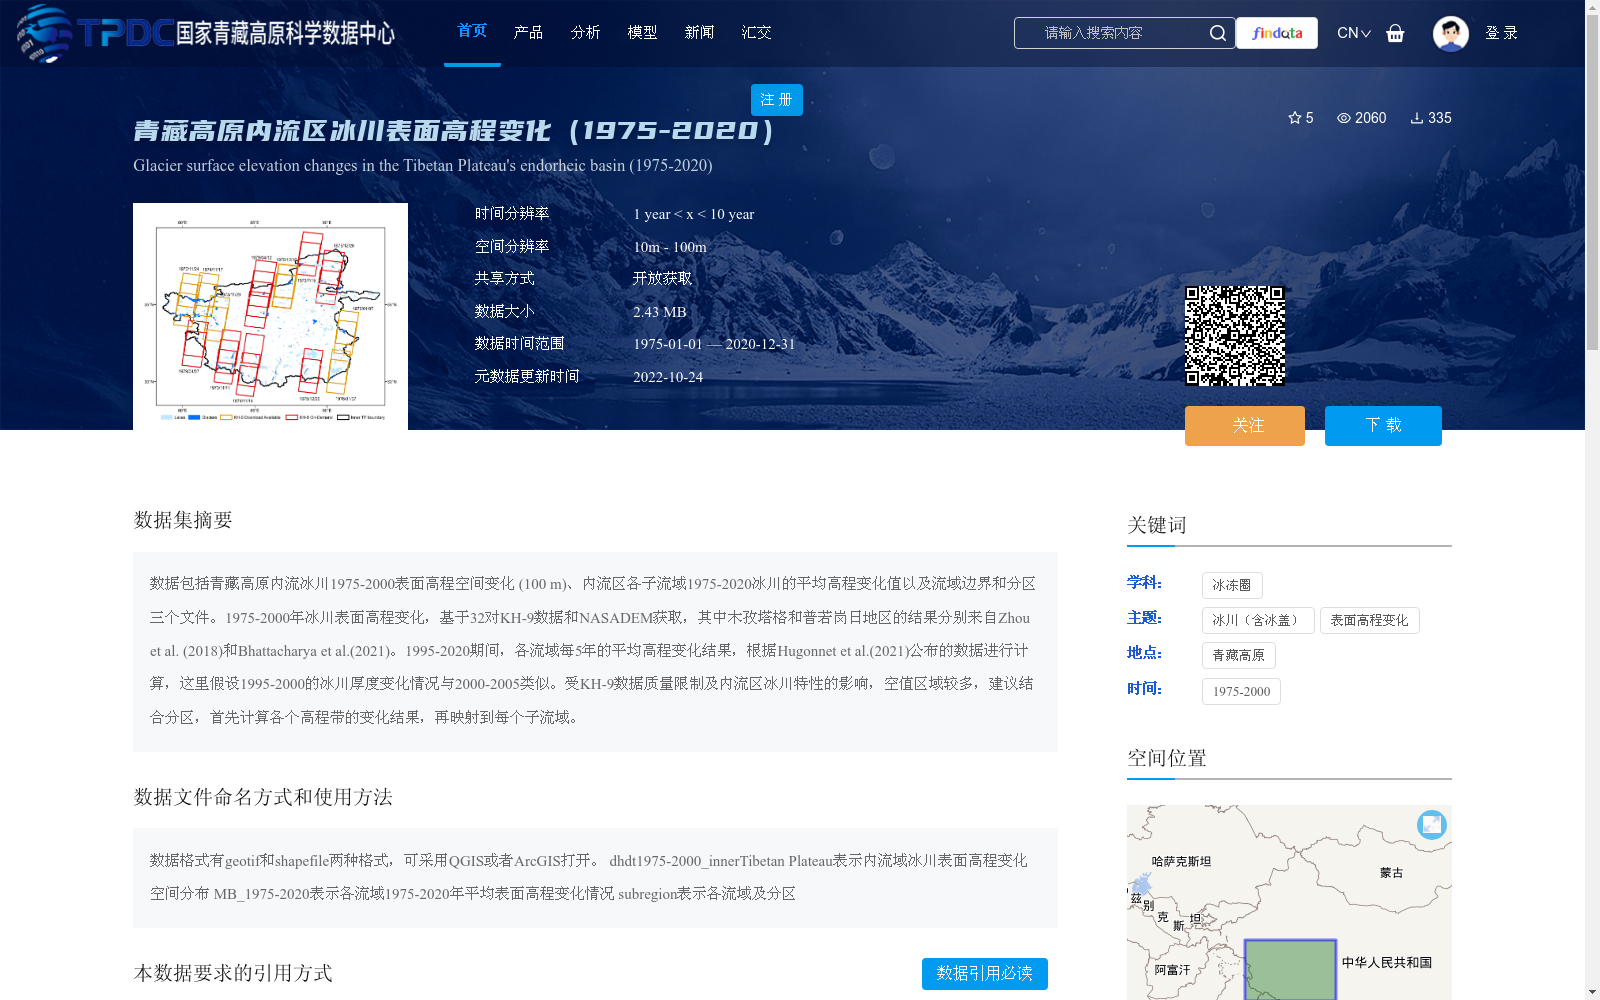
数据包括青藏高原内流冰川1975-2000表面高程空间变化 (100 m)、内流区各子流域1975-2020冰川的平均高程变化值以及流域边界和分区三个文件。1975-2000年冰川表面高程变化,基于32对KH-9数据和NASADEM获取,其中木孜塔格和普若岗日地区的结果分别来自Zhou et al. (2018)和Bhattacharya et al.(2021)。1995-2020期间,各流域每5年的平均高程变化结果,根据Hugonnet et al.(2021)公布的数据进行计算,这里假设1995-2000的冰川厚度变化情况与2000-2005类似。受KH-9数据质量限制及内流区冰川特性的影响,空值区域较多,建议结合分区,首先计算各个高程带的变化结果,再映射到每个子流域。
The dataset includes three files: spatial variations in surface elevation of endorheic glaciers on the Tibetan Plateau during 1975–2000 (100 m resolution), mean elevation change of glaciers in each sub-basin of the endorheic region during 1975–2020, as well as basin boundaries and regional zoning.
The glacier surface elevation changes during 1975–2000 were derived from 32 pairs of KH-9 satellite imagery and NASADEM; results for the Muztagh Ata and Puruogangri regions were respectively sourced from Zhou et al. (2018) and Bhattacharya et al. (2021).
The 5-year mean elevation change results for each basin during 1995–2020 were calculated using data published by Hugonnet et al. (2021), where it is assumed that glacier thickness changes between 1995–2000 are similar to those during 2000–2005.
Affected by the quality limitations of KH-9 data and the characteristics of glaciers in the endorheic region, there are numerous null value areas. It is recommended to first calculate the elevation change results for each elevation band based on the regional zoning, then map the results to each sub-basin.
提供机构:
陈文锋,张国庆
创建时间:
2022-10-20
搜集汇总
数据集介绍
背景与挑战
背景概述
该数据集提供了青藏高原内流区冰川在1975年至2020年间的表面高程变化信息,包括1975-2000年的空间分布变化和各子流域的平均高程变化值。数据具有较高的空间分辨率(10m-100m)和长时间跨度,基于多源遥感数据(如KH-9、NASADEM和Hugonnet et al.数据)计算生成,但受数据质量限制存在空值区域,建议结合分区进行分析。数据集以开放获取方式共享,适用于冰川变化研究和环境监测。
以上内容由遇见数据集搜集并总结生成


