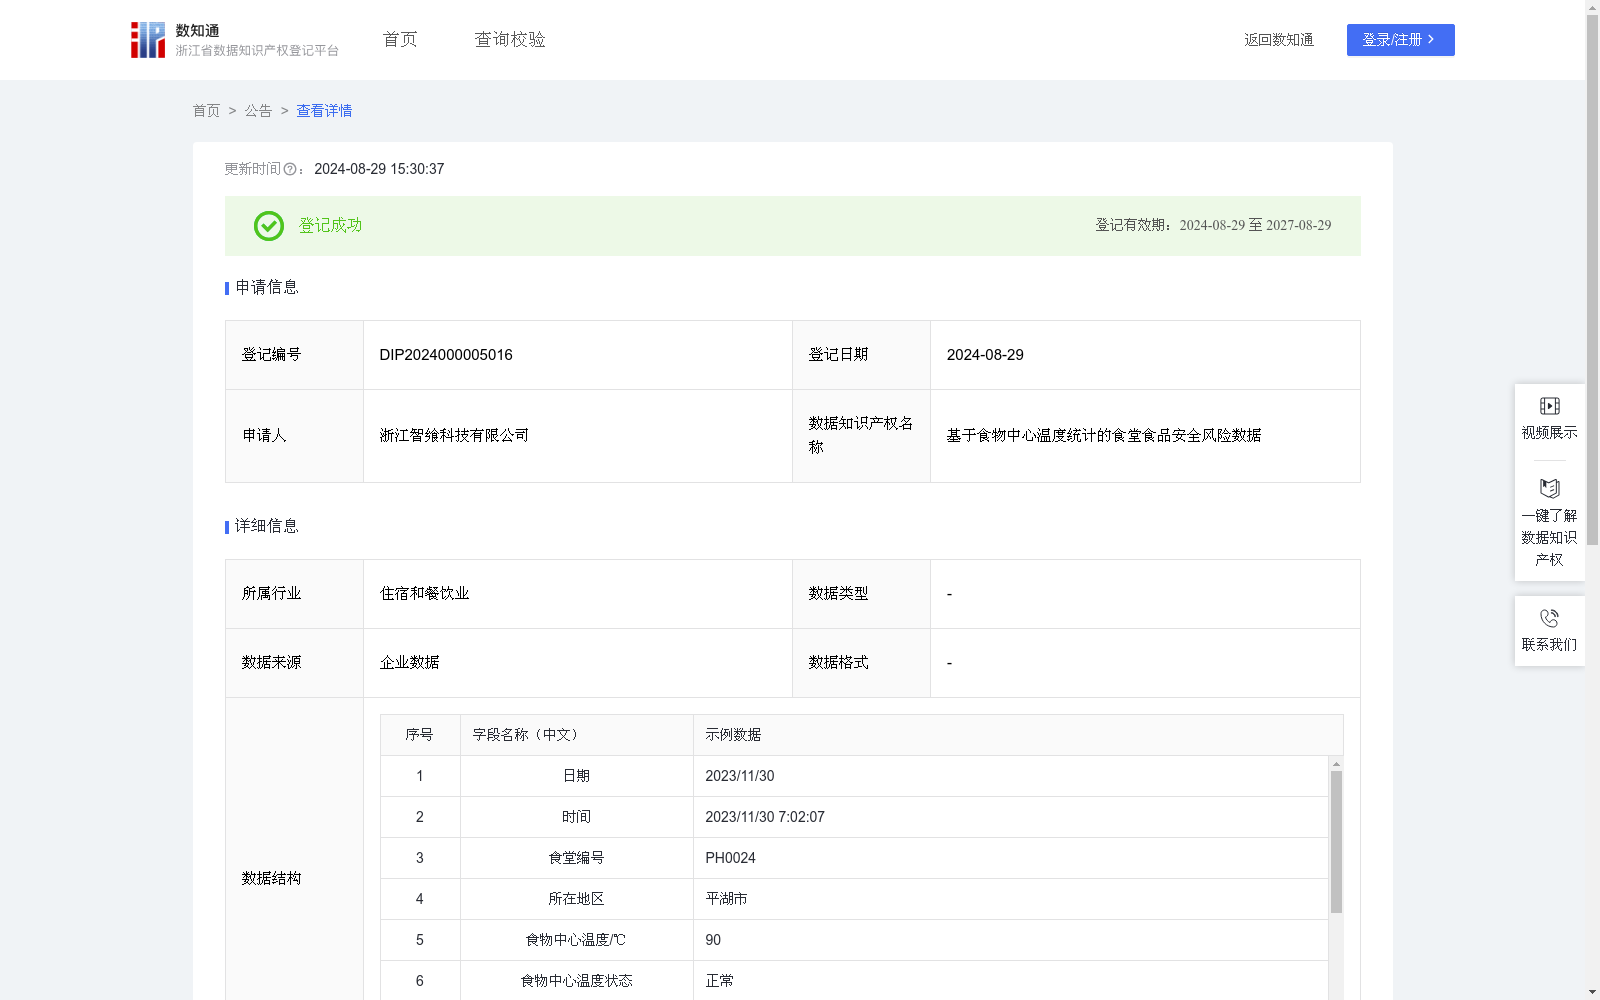
基于食物中心温度统计的食堂食品安全风险数据
收藏浙江省数据知识产权登记平台2024-08-29 更新2024-08-30 收录
下载链接:
https://www.zjip.org.cn/home/announce/trends/55984
下载链接
链接失效反馈官方服务:
资源简介:
基于食物中心温度统计的食堂食品安全风险指数是一个创新的量化工具,可用于评估因食物烹饪不当导致食物中心温度偏低可能对食品安全造成的风险程度。
1.食堂可以通过本数据了解当前食堂食品安全的整体风险情况,根据指数的变化及时发现因食物未煮熟导致的潜在食品安全问题,从而做出针对性的措施。2.餐饮监管部门可以利用本数据作为监管食堂食品安全的依据之一,可通过指数的变化及时发现食品安全风险较高的食堂,提前进行干预和指导。3.食堂或和监管机构可以将本数据对外披露公开,体现本单位或本地区对食物加工规范性的重视和承诺,有利于增强用餐者的信任。4.保险公司可根据本数据提前识别目标食堂客户的投保风险,从而确定相关保险产品的定价,如食品安全责任险。5.本数据还能为食品中心温度测试仪厂家对仪器进行功能改进或提升提供依据。1.数据抽取和预处理:
(1)数据抽取:在自研的5G智慧食安工业物联网数字化管理平台数据库中抽取相关食堂食物烹饪后的中心温度数据,包括日期、时间、食堂编号、所在地区、食物中心温度。(2)数据预处理:对抽取的数据进行清洗,去除重复、错误或无关的信息,以便后续的分析和建模。
2.基于食物中心温度统计数据预测食堂食品安全风险数据:
(1)食物中心温度状态判定:若食物中心温度<72℃,则判定为“异常”,反之则判定为“正常”;(2)计算近30日的总判定次数、异常次数和连续异常次数:利用SUM函数对近30日的总判定次数进行累加;利用CountIf函数分别对近30日的异常次数和连续异常次数进行累加;(3)计算近30日异常率和连续异常次数占比:近30日异常率=近30日异常次数÷近30日总判定次数×100%;近30日连续异常次数占比=近30日连续异常次数÷近30日总判定次数×100%;(4)建立食堂食品安全风险评估模型:基于食物中心温度统计的食堂食品安全风险指数=近30日异常率×a+近30日连续异常次数占比×b;a和b为对应的系数,属于我司商业秘密,故不作详细列举。
The Canteen Food Safety Risk Index based on food core temperature statistics is an innovative quantitative tool used to assess the degree of food safety risks that may be caused by improperly cooked food with low core temperature.
1. Canteens can use this dataset to understand the overall food safety risk status of their current operations, timely detect potential food safety issues caused by undercooked food based on changes in the index, and then take targeted measures.
2. Food safety regulatory authorities can use this dataset as one of the basis for supervising canteen food safety, timely identify canteens with high food safety risks based on index changes, and carry out early intervention and guidance.
3. Canteens or regulatory authorities can publicly disclose this dataset, demonstrating their emphasis on and commitment to standardized food processing, which helps enhance the trust of diners.
4. Insurance companies can use this dataset to early identify the underwriting risks of target canteen clients, so as to determine the pricing of relevant insurance products, such as food safety liability insurance.
5. This dataset can also provide a basis for food core temperature tester manufacturers to carry out functional improvements or upgrades of their instruments.
1. Data Extraction and Preprocessing:
(1) Data Extraction: Extract relevant post-cooking food core temperature data of canteens from the database of the self-developed 5G Smart Food Safety Industrial Internet of Things (IIoT) digital management platform, including date, time, canteen ID, location, and food core temperature.
(2) Data Preprocessing: Clean the extracted data to remove duplicate, erroneous or irrelevant information for subsequent analysis and modeling.
2. Prediction of Canteen Food Safety Risk Data Based on Food Core Temperature Statistics:
(1) Food Core Temperature Status Judgment: If the food core temperature is lower than 72°C, it is judged as "abnormal"; otherwise, it is judged as "normal";
(2) Calculate the total number of judgments, number of abnormal cases and number of consecutive abnormal cases in the past 30 days: Use the SUM function to accumulate the total number of judgments in the past 30 days; use the COUNTIF function to accumulate the number of abnormal cases and the number of consecutive abnormal cases in the past 30 days respectively;
(3) Calculate the abnormality rate and the proportion of consecutive abnormal cases in the past 30 days: Abnormality rate in the past 30 days = (Number of abnormal cases in the past 30 days / Total number of judgments in the past 30 days) × 100%; Proportion of consecutive abnormal cases in the past 30 days = (Number of consecutive abnormal cases in the past 30 days / Total number of judgments in the past 30 days) × 100%;
(4) Establish a canteen food safety risk assessment model: The canteen food safety risk index based on food core temperature statistics = Abnormality rate in the past 30 days × a + Proportion of consecutive abnormal cases in the past 30 days × b; Coefficients a and b are commercial secrets of our company and will not be listed in detail.
提供机构:
浙江智飨科技有限公司
创建时间:
2024-08-05
搜集汇总
数据集介绍
特点
该数据集记录了食堂食物的中心温度及其状态信息,包含1017条记录,每日更新。通过食物中心温度统计数据预测食堂食品安全风险,应用场景包括食堂食品安全评估、餐饮监管和保险定价等。
以上内容由遇见数据集搜集并总结生成


