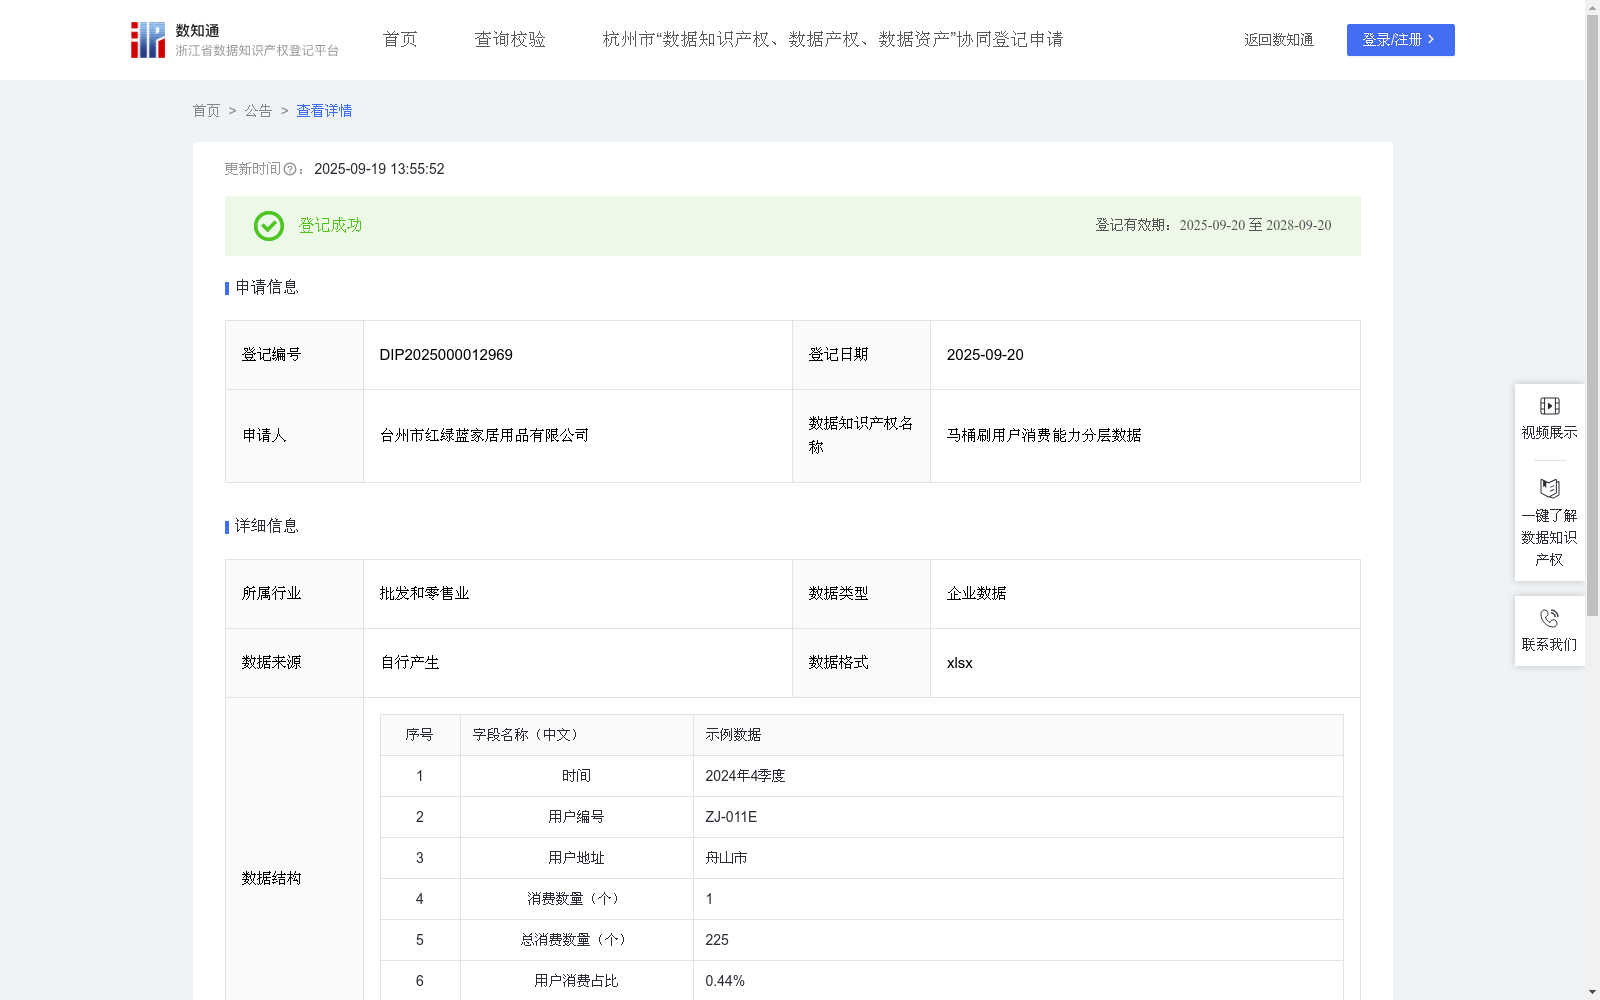
马桶刷用户消费能力分层数据
收藏资源简介:
统计分析马桶刷消费数据,通过对历史下单用户画像建立,对用户进行标签制定,定位用户消费级别,可以为不同区域产品周转仓的设立以及消费者广告营销策略提供数据支持。1、采集各季度的各个用户购买马桶刷的数量等数据。2、数据加工:当季总消费数量为各个用户购买马桶刷的数量之和,用户消费占比(%)=消费数量/总消费数量*100%。3、用户消费能力运用ABCDEF分类法,对消费占比≥3%的,给予“A类”用户分级;消费占比≥2%不足3%的,给予“B类”用户分级;消费占比≥1%不足2%区间的,给予“C类”用户分级;消费占比≥0.5%不足1%区间的,给予“D类”用户分级;消费占比≥0.1%不足0.5%区间的,给予“E类”用户分级;消费占比<0.1%的,给予“F类”用户分级。
This dataset is constructed via statistical analysis of toilet brush consumption data, leveraging user portraits of historical purchasers to develop user labels and classify user consumption tiers, which provides data support for the establishment of regional product turnover warehouses and the formulation of consumer advertising and marketing strategies. 1. Data Collection: Collect data including the quantity of toilet brushes purchased by each user in each quarter. 2. Data Preprocessing: The total consumption quantity for the current quarter is the sum of the toilet brush purchase quantities of all users; the user consumption share (%) is calculated as (consumption quantity / total consumption quantity) × 100%. 3. User Consumption Tier Classification: Apply the ABCDEF classification method to grade users: Class A for users with a consumption share of ≥ 3%; Class B for users with 2% ≤ consumption share < 3%; Class C for users with 1% ≤ consumption share < 2%; Class D for users with 0.5% ≤ consumption share < 1%; Class E for users with 0.1% ≤ consumption share < 0.5%; Class F for users with a consumption share of < 0.1%.