
mayadeeb08/car-insurance-eda
收藏Hugging Face2026-04-10 更新2026-04-12 收录
下载链接:
https://hf-mirror.com/datasets/mayadeeb08/car-insurance-eda
下载链接
链接失效反馈官方服务:
资源简介:
# Car Insurance Claim Analysis
## Overview
This project presents an Exploratory Data Analysis (EDA) of the **Car Insurance Claim** dataset.
The goal of the analysis is to explore which factors may influence whether an individual files an insurance claim.
The target variable in this dataset is **OUTCOME**, where:
- **0** = No claim
- **1** = Claim
---
## Dataset Information
- **Dataset name:** Car Insurance Claim Dataset
- **Source:** Kaggle
- **Dataset link:** https://www.kaggle.com/datasets/sagnik1511/car-insurance-data
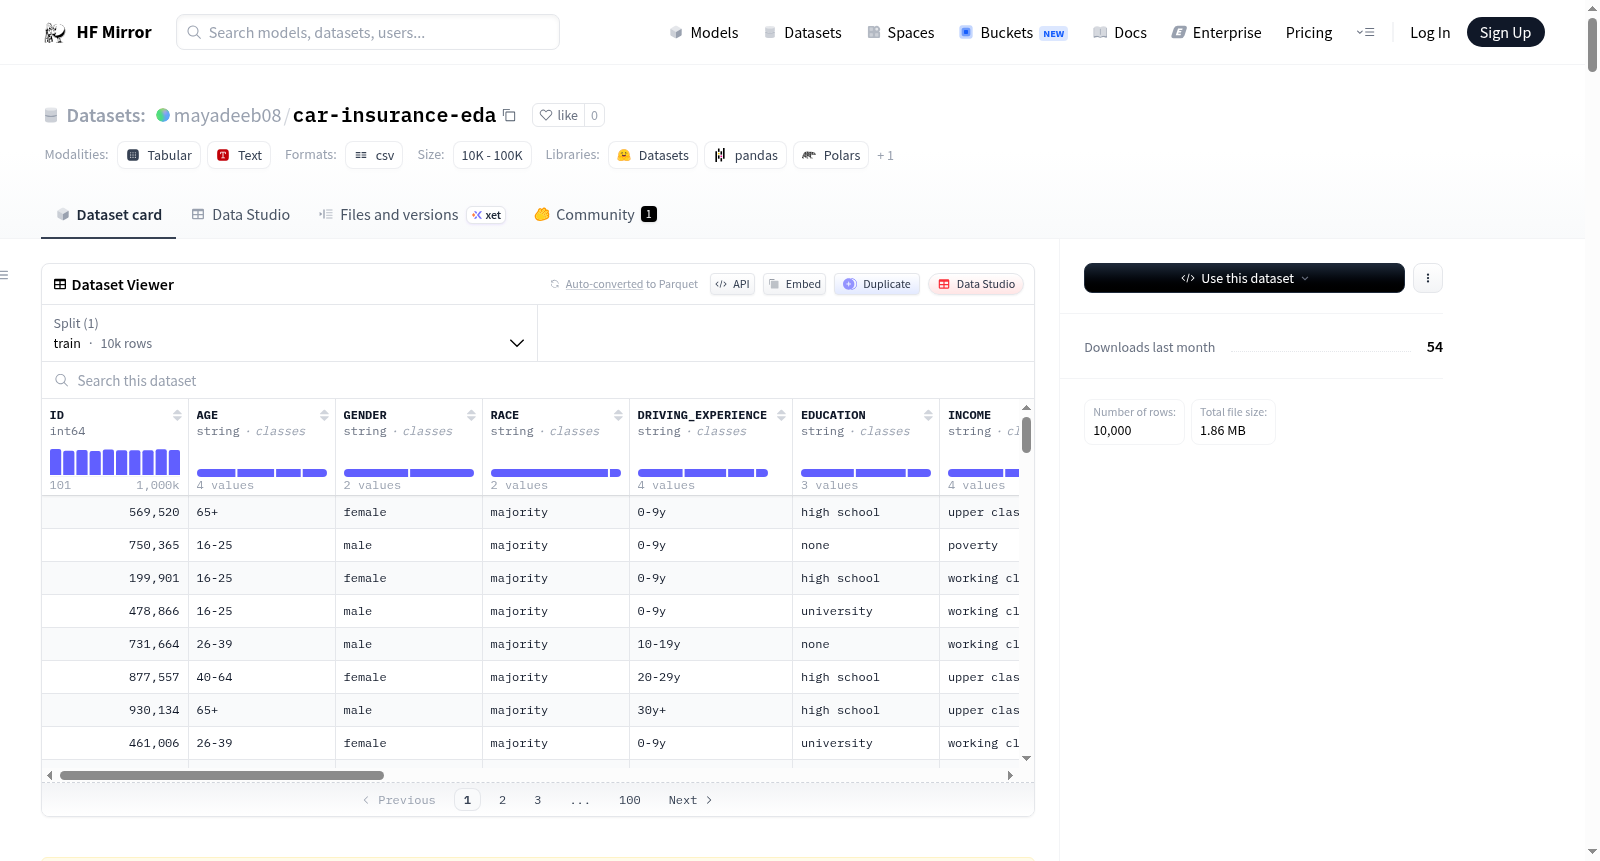
This dataset contains demographic, financial, and driving-related information about individuals, including variables such as:
- Age group
- Credit score
- Driving experience
- Annual mileage
- Speeding violations
- DUIs
- Past accidents
- Vehicle year
- Vehicle type
- Children
- Marital status
The dataset includes mostly numeric features, which makes it suitable for statistical analysis and visualization.
---
## Research Goal
The main question explored in this project is:
**What factors influence whether a person files an insurance claim?**
---
## Data Cleaning
The dataset was examined for data quality issues before analysis.
- Missing Values
Missing values were checked across all columns. Most columns did not contain missing values, while a few columns had some missing entries.
- Duplicate Rows
Duplicate entries were checked, and no duplicate rows were found.
- Inconsistencies
Categorical columns were reviewed for inconsistencies such as typos or irregular values. The categories appeared consistent and well-structured.
- Date Parsing
The dataset was reviewed for date or time-related features. No date columns were found, so no date parsing was required.
- Scaling Issues
Numeric features were reviewed for scaling differences. Some variables, such as annual mileage and credit score, are measured on different scales. This does not affect EDA directly, but it may be relevant in future modeling.
---
## Outlier Detection & Handling
Outliers were examined using distribution plots for the following variables:
- ANNUAL_MILEAGE
- SPEEDING_VIOLATIONS
- DUIS
- PAST_ACCIDENTS
The distributions showed that most values are concentrated near the lower range, especially for DUIs and past accidents. However, some extreme values appeared in the higher ranges, indicating possible outliers.
### Decision
The extreme values were **not removed**, because they may represent real-world risky driving behavior rather than errors. Keeping them makes the dataset more realistic and informative.
---
## Descriptive Statistics
Descriptive statistics were used to summarize the numeric variables in the dataset.
- ID and POSTAL_CODE were removed before calculating descriptive statistics because they are not meaningful analytical features.
- Summary statistics included mean, standard deviation, minimum, maximum, and quartiles.
- A correlation heatmap was used to examine relationships between numeric variables.


### Main Insight
Most variables showed **weak to moderate correlations**, suggesting that no single feature strongly dominates the prediction. Instead, multiple factors may contribute to insurance claim behavior.
---
## Visualizations, Questions, and Insights
### 1. Distribution of Insurance Claims
**What was done:**
A count plot was used to visualize the distribution of the target variable (**OUTCOME**).
**Question:**
Is the dataset balanced in terms of insurance claims?

**Answer / Insight:**
The visualization shows that there are significantly more individuals who did **not** file a claim (**OUTCOME = 0**) than individuals who did (**OUTCOME = 1**).
This indicates that the dataset is **imbalanced**.
---
### 2. Age Group Among Claimants
**What was done:**
A pie chart was used to visualize the distribution of age groups among individuals who filed an insurance claim.
**Question:**
Does age affect the likelihood of filing an insurance claim?

**Answer / Insight:**
The analysis suggests that **younger individuals are more likely to file insurance claims** compared to older age groups.
---
### 3. Vehicle Year vs Insurance Claim
**What was done:**
A count plot was used to compare vehicle year and insurance claim outcomes.
**Question:**
Does vehicle age affect the likelihood of filing an insurance claim?

**Answer / Insight:**
Individuals with **older vehicles (before 2015)** are more likely to file insurance claims compared to those with newer vehicles.
This suggests that **vehicle age may influence claim behavior**.
---
### 4. Credit Score vs Insurance Claim
**What was done:**
A histogram was used to compare credit score distributions across claim outcomes.
**Question:**
Does credit score affect the likelihood of filing an insurance claim?

**Answer / Insight:**
Individuals who filed insurance claims tend to have **lower credit scores**, while those who did not file claims generally have **higher credit scores**.
This suggests that **credit score is an important factor** in predicting insurance claims.
---
### 5. Children and Driving Experience
**What was done:**
A heatmap was used to examine claim rates based on the combination of **having children** and **driving experience**.
**Question:**
How do having children and driving experience together affect the likelihood of filing an insurance claim?

**Answer / Insight:**
The heatmap shows that individuals with **less driving experience** tend to have higher claim rates, regardless of whether they have children.
Among more experienced drivers, those with children tend to have slightly lower claim rates.
This suggests that **driving experience is a stronger factor**, while having children may be associated with more cautious driving among experienced individuals.
---
### 6. Credit Score and Driving Experience
**What was done:**
A heatmap was used to examine how credit score and driving experience together influence insurance claim rates. Credit score was grouped into categories to better visualize patterns across different levels.
**Question:**
How do credit score and driving experience together affect the likelihood of filing an insurance claim?

**Answer / Insight:**
The heatmap shows that individuals with both low credit scores and low driving experience have the highest claim rates. In contrast, individuals with high credit scores and more driving experience tend to have significantly lower claim rates. This suggests that the combination of financial responsibility and driving experience is a strong predictor of insurance claims.
---
## Key Decisions Made
During the analysis, the following decisions were made:
- **ID** and **POSTAL_CODE** were excluded from descriptive statistics and correlation analysis because they are not meaningful predictive features.
- Outliers were **kept** because they likely represent realistic extreme cases rather than data errors.
- No date parsing was performed because the dataset does not include date-related features.
- Categorical values were checked and found to be consistent.
- Missing values were identified in a small number of entries; however, they were not handled as their proportion was minimal and not expected to significantly affect the analysis results.
- The age variable was converted from categorical ranges into ordinal numeric values (0–3) to preserve the natural order of age groups and simplify analysis and visualization.
---
## Main Findings
The analysis demonstrates that insurance claim behavior is influenced by a combination of demographic, financial, and behavioral factors, rather than a single variable.
Key findings include:
- Age: Younger individuals are significantly more likely to file insurance claims. This may be due to lower driving experience and higher risk-taking behavior compared to older drivers.
- Credit Score: Individuals with lower credit scores tend to file more claims. This suggests a potential link between financial responsibility and driving behavior, where lower credit scores may be associated with higher risk profiles.
- Vehicle Year: Drivers with older vehicles are more likely to file claims. This may be explained by increased mechanical issues, lower safety standards, or higher likelihood of damage in older cars.
- Driving Experience: Less experienced drivers show higher claim rates, indicating that experience plays a critical role in reducing risk and improving driving behavior over time.
- Children and Driving Experience: When combining family status with driving experience, it was observed that drivers with less experience tend to have higher claim rates regardless of having children. However, among more experienced drivers, those with children tend to have slightly lower claim rates, suggesting more cautious driving behavior.
- Credit Score and Driving Experience: The combination of low credit score and low driving experience is associated with the highest claim rates, while high credit score and extensive driving experience are associated with lower risk. This highlights the importance of combining multiple factors when analyzing insurance behavior.
Overall, these findings indicate that insurance risk is shaped by multiple interacting factors, highlighting the importance of analyzing variables both individually and in combination.
---
## Conclusion
This analysis reveals clear and meaningful patterns in insurance claim behavior. The results show that younger individuals, drivers with lower credit scores, and owners of older vehicles are significantly more likely to file insurance claims.
Additionally, driving experience plays a critical role, with less experienced drivers showing higher claim rates. In contrast, factors such as speeding violations and annual mileage were found to have a weaker and less consistent impact on claim behavior.
In particular, the combination of credit score and driving experience provides a strong distinction between high-risk and low-risk individuals.
These findings highlight that insurance claims are influenced by a combination of demographic, financial, and behavioral factors, rather than a single dominant variable.
Overall, the dataset provides valuable insights into risk patterns and demonstrates strong potential for predictive modeling and decision-making in insurance analytics.
---
## Files Included
This Hugging Face dataset repository includes:
- The original dataset file
- The Jupyter Notebook (`.ipynb`)
- The README file
- The presentation video
提供机构:
mayadeeb08
搜集汇总
数据集介绍
构建方式
该数据集源自Kaggle平台,旨在探索影响个人是否提交汽车保险理赔的关键因素。数据集涵盖了人口统计学、金融状况及驾驶行为等多维信息,包括年龄组、信用评分、驾驶经验、年均里程、超速违章、酒驾记录、过往事故、车辆年份与类型、子女状况及婚姻状态等变量。目标变量OUTCOME以二值形式标记理赔与否(0代表无理赔,1代表有理赔)。数据清洗过程中,缺失值与重复行被审慎检查,异常值如极高里程或违章记录因可能反映真实风险行为而被保留,未作剔除。年龄组变量被转换为有序数值以简化分析,整体数据质量良好,适合进行深入的统计探索与可视化。
特点
数据集的显著特点在于其结构完整且特征丰富,多为数值型变量,便于统计建模。通过探索性分析揭示了理赔行为的多因素交互性:年轻驾驶者、信用评分较低者及老旧车辆拥有者的理赔率显著偏高;驾驶经验不足与低信用评分的组合呈现出最高风险,而高信用评分与丰富驾驶经验则对应较低风险。此外,子女因素在经验丰富驾驶者中与更谨慎的驾驶行为关联,进一步展示了变量间复杂的协同效应。该数据集虽存在类别不平衡(无理赔样本居多),但异常值的保留增强了其真实性与应用价值。
使用方法
该数据集适用于保险精算领域的风险建模与因子分析研究。使用者可直接加载CSV文件,利用Scikit-learn、Pandas等Python库进行逻辑回归、随机森林或梯度提升模型训练,预测理赔概率。建议在建模前对年均里程、信用评分等特征进行标准化处理,并采用过采样或欠采样技术缓解类别不平衡问题。研究人员可复现README中的可视化分析,或深入探究酒驾、超速违章等行为变量与理赔的关联,以构建更稳健的风险评估框架,支撑保险定价与决策优化。
背景与挑战
背景概述
在保险精算与风险管理的交叉领域中,车险索赔预测始终是核心议题,旨在通过投保人的人口统计学、财务及驾驶行为特征识别潜在的高风险群体。该Car Insurance Claim数据集由研究者于Kaggle平台发布,聚焦于探索影响个人是否提交保险索赔的多维因素,核心研究问题在于揭示年龄、信用评分、驾龄、车辆年份及违规记录等变量对索赔行为的综合作用。该数据集涵盖超过十万条记录,包含年龄组、信用评分、年里程、超速违规、酒驾及过往事故等特征,其公开性为保险科技领域的预测建模提供了宝贵的基准资源,尤其对推动基于多因素交互的精准风险评估具有重要影响力。
当前挑战
该数据集面临的挑战首先体现在领域问题的复杂性上:保险索赔行为并非由单一变量主导,而是年龄、财务信用与驾驶经验等多因素交织的非线性结果,现有分析发现弱至中度相关性表明传统线性模型难以捕捉深层模式。其次,构建过程中的挑战包括严重的类别不平衡(未索赔样本显著多于索赔样本),这可能导致模型偏向多数类;异常值的保留虽反映真实高风险行为,却增加了噪声干扰;同时,数值特征如年里程与信用评分量纲差异大,缺失值虽少但未处理可能影响统计推断的稳健性。此外,年龄变量需从分类转为有序数值以适配分析,而缺少时间特征限制了时序效应的建模能力。
常用场景
经典使用场景
该数据集在保险精算与风险管理领域被广泛用于构建理赔预测模型,通过整合投保人的年龄、信用评分、驾驶经验、年度行驶里程、交通违规记录及车辆年份等多维特征,探索影响汽车保险理赔行为的关键因素。研究人员常运用逻辑回归、决策树或梯度提升机等监督学习算法,以理赔与否作为二分类目标变量,挖掘各类风险因子与出险概率之间的量化关系。此外,该数据集亦适用于不平衡分类问题的研究,因为样本中未理赔案例远多于理赔案例,为处理类别失衡的建模方法提供了典型的实验场景。
解决学术问题
该数据集有效回应了保险科学中长期存在的核心学术问题——如何从异质性个体特征中识别出理赔风险的关键驱动因子。传统费率厘定往往依赖单一变量如年龄或车型,而本数据集通过多维度协同分析,揭示了信用评分与驾驶经验等复合特征在风险区分中的显著作用,挑战了以往仅凭简单分组的风险评估范式。其产出成果直接推动了保险精算学从粗放式定价向精细化风险画像的转型,并为后续研究提供了可复现的基准数据,对理解道德风险、逆向选择等经济学现象在车险市场的具体表现具有重要的理论支撑价值。
衍生相关工作
围绕本数据集,学界衍生出多项经典工作,如运用SMOTE过采样或代价敏感学习来缓解理赔样本不平衡问题的比较研究,以及引入SHAP解释性框架对信用评分与驾驶经验交互效应进行可视化归因的探索。另有学者以此为基础,构建了贝叶斯分层模型以量化家庭结构与驾驶经验对风险的后验分布,拓展了传统广义线性模型在保险分析中的应用边界。在特征工程方向,研究者设计了基于行驶里程与违规记录的非线性组合特征,显著提升了梯度提升模型的泛化性能。这些衍生工作共同构建了一个从探索性分析到可解释预测的完整研究链条,持续推动着数据驱动保险分析技术的发展。
以上内容由遇见数据集搜集并总结生成



