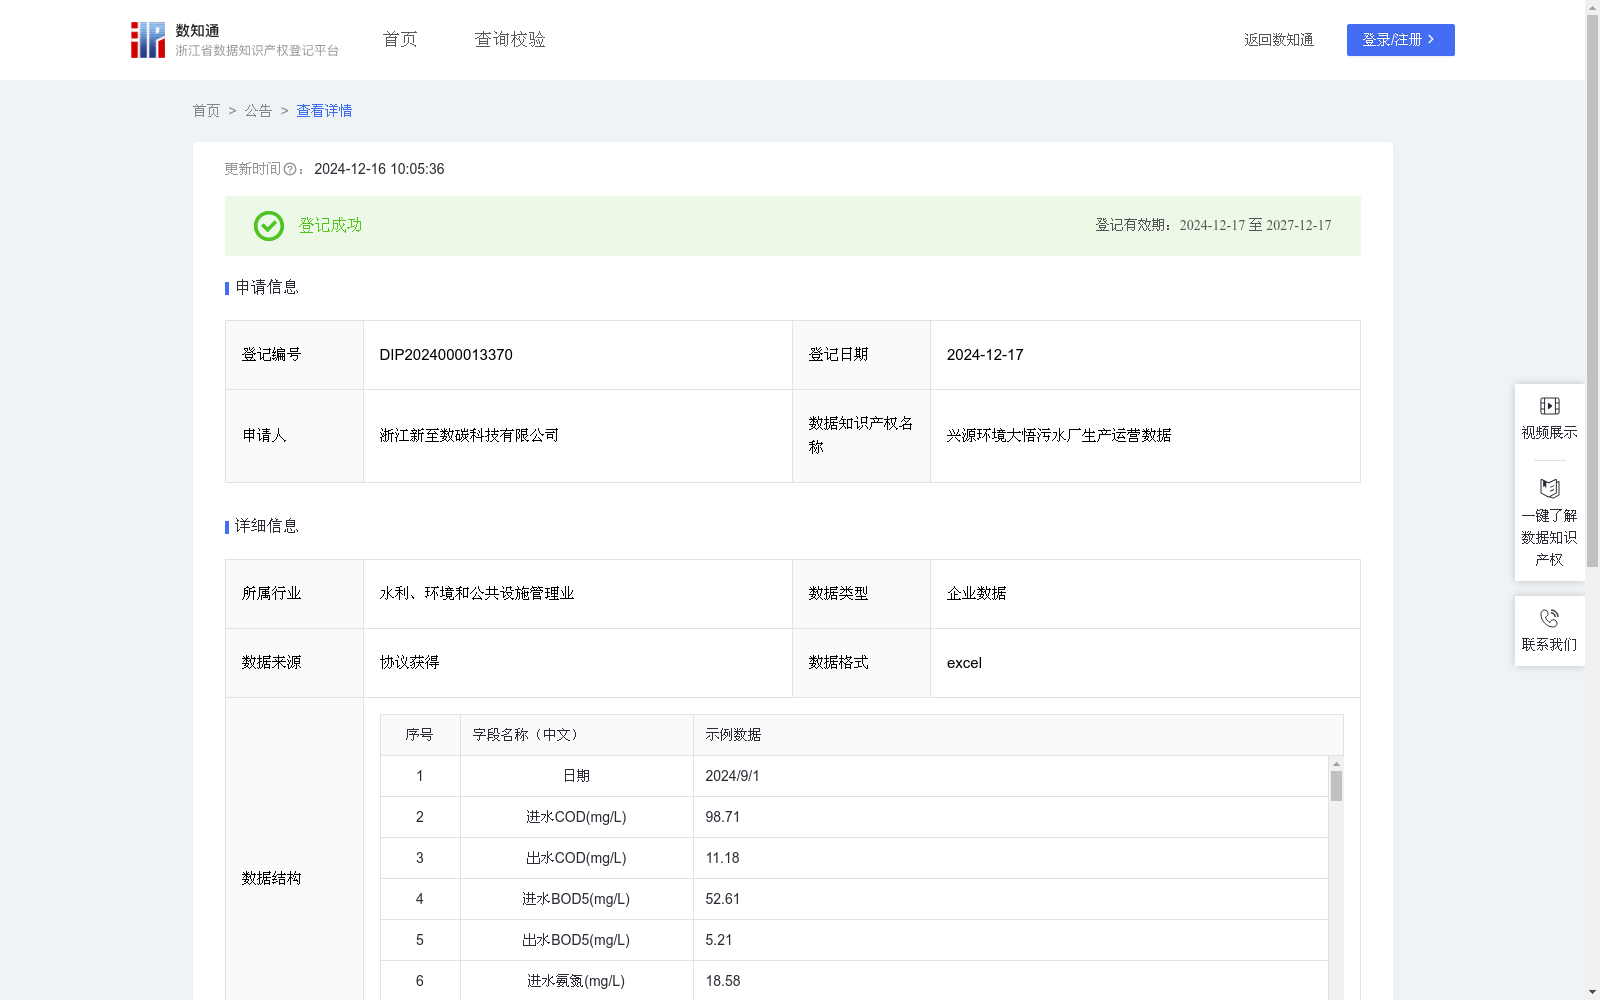
兴源环境大悟污水厂生产运营数据
收藏浙江省数据知识产权登记平台2024-12-16 更新2024-12-17 收录
下载链接:
https://www.zjip.org.cn/home/announce/trends/104421
下载链接
链接失效反馈官方服务:
资源简介:
1、污水处理厂单耗分析:通过对进水COD、出水COD、进水氨氮、出水氨氮、出水总磷等进行分析,对于异常的,加以分析生产工艺和处理流程,及时改掉不必要的消耗,以便降低运营成本和提升效率。2、平均值分析:根据平均值判断现场正常运行调试指标是否正常。通过对污水处理厂浓缩池污泥浓度、泥龄、工业区PH(无量纲)、工业区氨氮等数据的统计分析,能够有效地监控污水处理厂运营情况,提升污水处理质量和生产运营效率。1、数据采集:采集进水COD、出水COD、进水氨氮、出水氨氮、出水总磷等数据;
2、数据处理:对采集到数据进行去重、得到运营数据,便于分析使用;
3、算法加工:将处理好的数据按最小值、最大值、平均值、总计进行算法加工,平均值 =(每天数据总和)/(本月天数),例如:平均值-进水COD(mg/L)=总 量-进水COD(mg/L)/当月天数,
平均值-出水COD(mg/L)=总 量-出水COD(mg/L)/当月天数,平均值-进水BOD5(mg/L)=总 量-进水BOD5(mg/L)/当月天数,平均值-出水BOD5(mg/L)=总 量-出水BOD5(mg/L)/当月天数,平均值-进水氨氮(mg/L)=总 量-进水氨氮(mg/L)/当月天数,平均值-出水氨氮(mg/L)=总 量-出水氨氮(mg/L)/当月天数,平均值-进水总磷(mg/L)=总 量-进水总磷(mg/L)/当月天数,平均值-出水总磷(mg/L)=总 量-出水总磷(mg/L)/当月天数,平均值-进水总氮(mg/L)=总 量-进水总氮(mg/L)/当月天数,平均值-出水总氮(mg/L)=总 量-出水总氮(mg/L)/当月天数;
1. Specific Energy Consumption Analysis for Sewage Treatment Plants: Analyze influent Chemical Oxygen Demand (COD), effluent COD, influent ammonia nitrogen, effluent ammonia nitrogen, effluent total phosphorus, and other related parameters. For abnormal situations, analyze the production processes and treatment workflows to eliminate unnecessary energy consumption in a timely manner, so as to reduce operating costs and improve efficiency.
2. Average Value Analysis: Judge whether the on-site normal operation and commissioning indicators are normal based on average values. Through statistical analysis of data such as sludge concentration in thickeners, sludge age, pH (dimensionless) of the industrial zone, ammonia nitrogen of the industrial zone, etc., the operational status of sewage treatment plants can be effectively monitored, and the sewage treatment quality and production and operational efficiency can be improved.
### Data Processing Workflow
1. Data Collection: Collect data including influent COD, effluent COD, influent ammonia nitrogen, effluent ammonia nitrogen, effluent total phosphorus, and other relevant parameters;
2. Data Processing: Deduplicate the collected data to obtain available operational data for analysis purposes;
3. Algorithmic Processing: Perform algorithmic processing on the cleaned data according to minimum value, maximum value, average value, and total value. The average value is calculated as (total daily data sum) / (number of days in the current month). For example:
- Average Influent COD (mg/L) = Total Influent COD (mg/L) / Number of Days in Current Month
- Average Effluent COD (mg/L) = Total Effluent COD (mg/L) / Number of Days in Current Month
- Average Influent BOD₅ (mg/L) = Total Influent BOD₅ (mg/L) / Number of Days in Current Month
- Average Effluent BOD₅ (mg/L) = Total Effluent BOD₅ (mg/L) / Number of Days in Current Month
- Average Influent Ammonia Nitrogen (mg/L) = Total Influent Ammonia Nitrogen (mg/L) / Number of Days in Current Month
- Average Effluent Ammonia Nitrogen (mg/L) = Total Effluent Ammonia Nitrogen (mg/L) / Number of Days in Current Month
- Average Influent Total Phosphorus (mg/L) = Total Influent Total Phosphorus (mg/L) / Number of Days in Current Month
- Average Effluent Total Phosphorus (mg/L) = Total Effluent Total Phosphorus (mg/L) / Number of Days in Current Month
- Average Influent Total Nitrogen (mg/L) = Total Influent Total Nitrogen (mg/L) / Number of Days in Current Month
- Average Effluent Total Nitrogen (mg/L) = Total Effluent Total Nitrogen (mg/L) / Number of Days in Current Month
提供机构:
浙江新至数碳科技有限公司
创建时间:
2024-10-24
搜集汇总
数据集介绍
特点
该数据集包含兴源环境大悟污水厂的生产运营数据,涵盖污水处理过程中的多个关键指标,数据规模为680条,每日更新,适用于污水处理厂的运营分析和效率提升。
以上内容由遇见数据集搜集并总结生成


