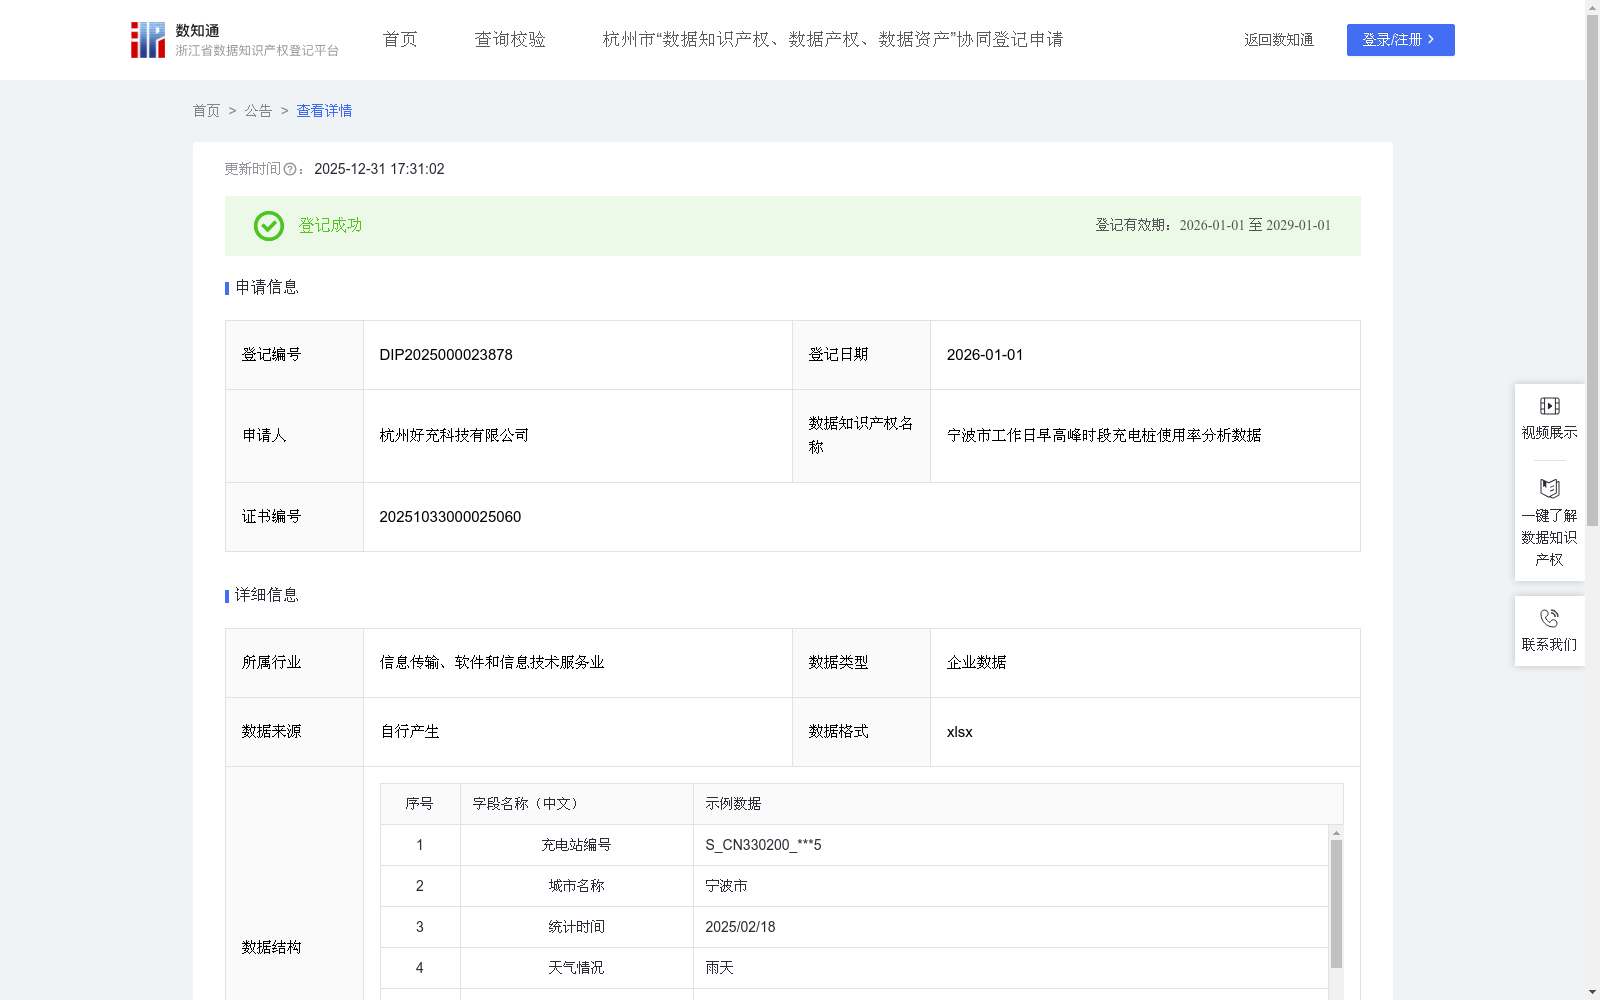
宁波市工作日早高峰时段充电桩使用率分析数据
收藏资源简介:
本数据通过分析宁波市工作日早高峰时段充电桩使用特征,为充电服务优化提供决策支持。主要应用于:指导运营商根据负载压力指数动态调整充电桩功率配置,在高负荷站点实施功率提升和排队预警,在低负荷站点推出错峰充电优惠;可为导航平台提供实时充电站负载数据,优化用户充电路线规划;协助城市交通管理部门分析电动汽车充电需求与交通拥堵的关联性,为充电基础设施规划提供参考依据。同时可为电力部门提供早高峰充电负荷预测,助力电网调峰调度。 "1.数据采集 采集企业自有充电桩设备管理数据,包括充电站编号、城市名称、统计时间、天气情况、充电桩配置情况、各桩充电时长、时段订单量、近30天同时段平均订单量、交通拥堵指数a等数据。 2.数据处理与计算 对原始数据进行清洗,剔除充电时长小于3分钟或大于2小时的异常记录。保留工作日早高峰时段7:00-9:00时段的完整充电记录,按充电站维度聚合计算 ①各桩使用率(μ): μ=各桩充电时长/120分钟 ②站点高峰系数(λ): λ=时段订单量/近30天同时段平均订单量 ③负载压力指数(ρ): ρ= (∑μ/桩数)×(1+0.3×a+0.1×λ)×ε 其中ε为天气系数:晴天/阴天=1.0,雨天=1.2,雪天=1.5 3.分级优化策略 根据负载压力指数ρ值进行分级并提供对应优化策略: ρ>1.8,优化策略为:将50%快充桩功率提升20%;在导航平台标注“预计排队>20分钟”;向周边3公里内用户推送空闲充电站信息 1.3<ρ≤1.8,优化策略为:将30%快充桩功率提升10%;执行峰时电价(基准价×1.1) 0.8≤ρ≤1.3,优化策略为:维持标准运营模式 ρ<0.8,优化策略为:推出时段优惠(电价×0.8);推送""错峰充电奖励""通知"
This dataset analyzes the charging pile usage characteristics during the morning peak hours on workdays in Ningbo City to provide decision support for charging service optimization. Its main applications are as follows: guiding charging pile operators to dynamically adjust the power configuration of charging piles based on the load pressure index, implementing power upgrades and queuing warning systems at high-load stations, and launching off-peak charging discounts at low-load stations; providing real-time charging station load data for navigation platforms to optimize users' charging route planning; assisting urban traffic management departments in analyzing the correlation between electric vehicle charging demand and traffic congestion to provide reference for charging infrastructure planning; and providing morning peak charging load forecasting for power departments to support grid peak load regulation and dispatch. 1. Data Collection Collect management data of self-owned charging pile equipment from enterprises, including charging station ID, city name, statistical time, weather conditions, charging pile configuration, charging duration of each pile, order volume during the period, average order volume of the same time period in the past 30 days, traffic congestion index a, and other related data. 2. Data Processing and Calculation Clean the original data to eliminate abnormal records where the charging duration is less than 3 minutes or more than 2 hours. Retain complete charging records during the morning peak hours (7:00-9:00) on workdays, and perform aggregate calculations by charging station dimension: ① Pile utilization rate (μ): μ = Charging duration of each pile / 120 minutes ② Station peak coefficient (λ): λ = Order volume during the period / Average order volume of the same time period in the past 30 days ③ Load pressure index (ρ): ρ = (∑μ / Number of charging piles) × (1 + 0.3×a + 0.1×λ) × ε Where ε is the weather coefficient: 1.0 for sunny/overcast days, 1.2 for rainy days, and 1.5 for snowy days. 3. Hierarchical Optimization Strategy Classify based on the load pressure index ρ value and provide corresponding optimization strategies: - When ρ > 1.8: Upgrade the power of 50% of fast-charging piles by 20%; mark "Estimated queuing time > 20 minutes" on the navigation platform; push notifications of idle charging stations within 3 kilometers to surrounding users. - When 1.3 < ρ ≤ 1.8: Upgrade the power of 30% of fast-charging piles by 10%; implement peak-time electricity price (benchmark price × 1.1). - When 0.8 ≤ ρ ≤ 1.3: Maintain the standard operation mode. - When ρ < 0.8: Launch time-period discounts (electricity price × 0.8); push "Off-peak charging reward" notifications.