<strong>Phenotypic Characteristics of Cancer-Cachexia Across Time Points Following C26-tumor Implantation</strong>
收藏资源简介:
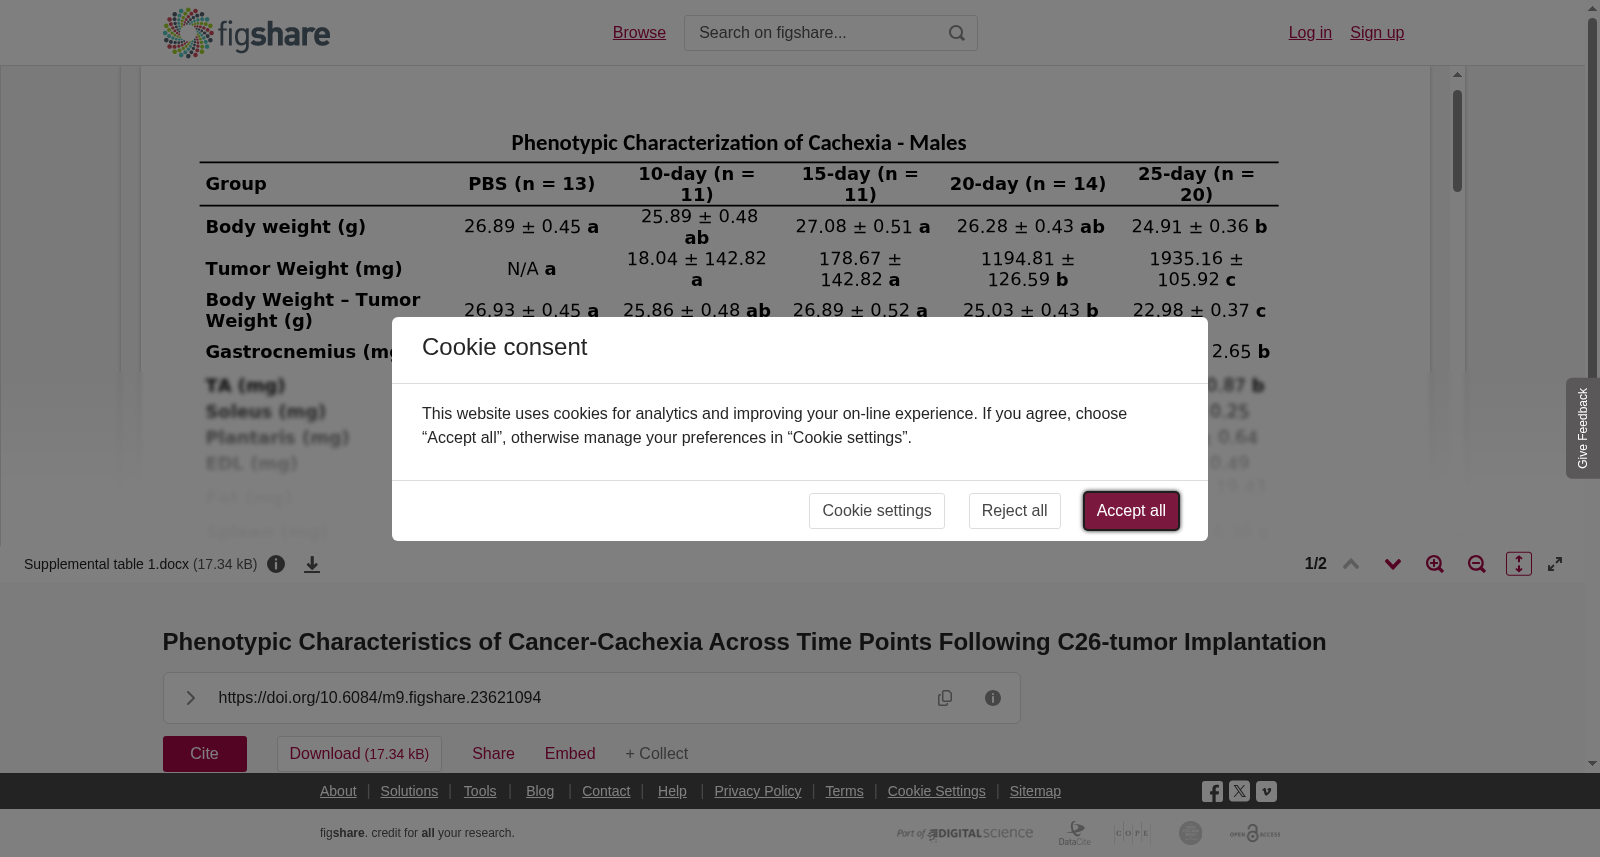
Body weight (g), tumor weight (mg), tumor-free body weight (g), wet weights of gastrocnemius, tibialis anterior (TA), soleus, plantaris, and extensor digitorum longus (EDL), gonadal fat, spleen, liver, and heart – (mg), and tibia length (mm). Weights were analyzed covaried to tibia length to statistically account for any variance in body size between experimental groups. All values are represented as least square mean ± standard error of the mean (SEM). Labelling with different letters represents one-way anova statistical differences of each group comparison at Tukey-adjusted with alpha value set at p<0.05 within each sex. No statistically significant differences between groups within each sex is found if the label shares a common letter. If groups are marked by different letters the groups are statistically different from one another. n=11-20/group. PBS, phosphate-buffered saline. Upper table male weights.