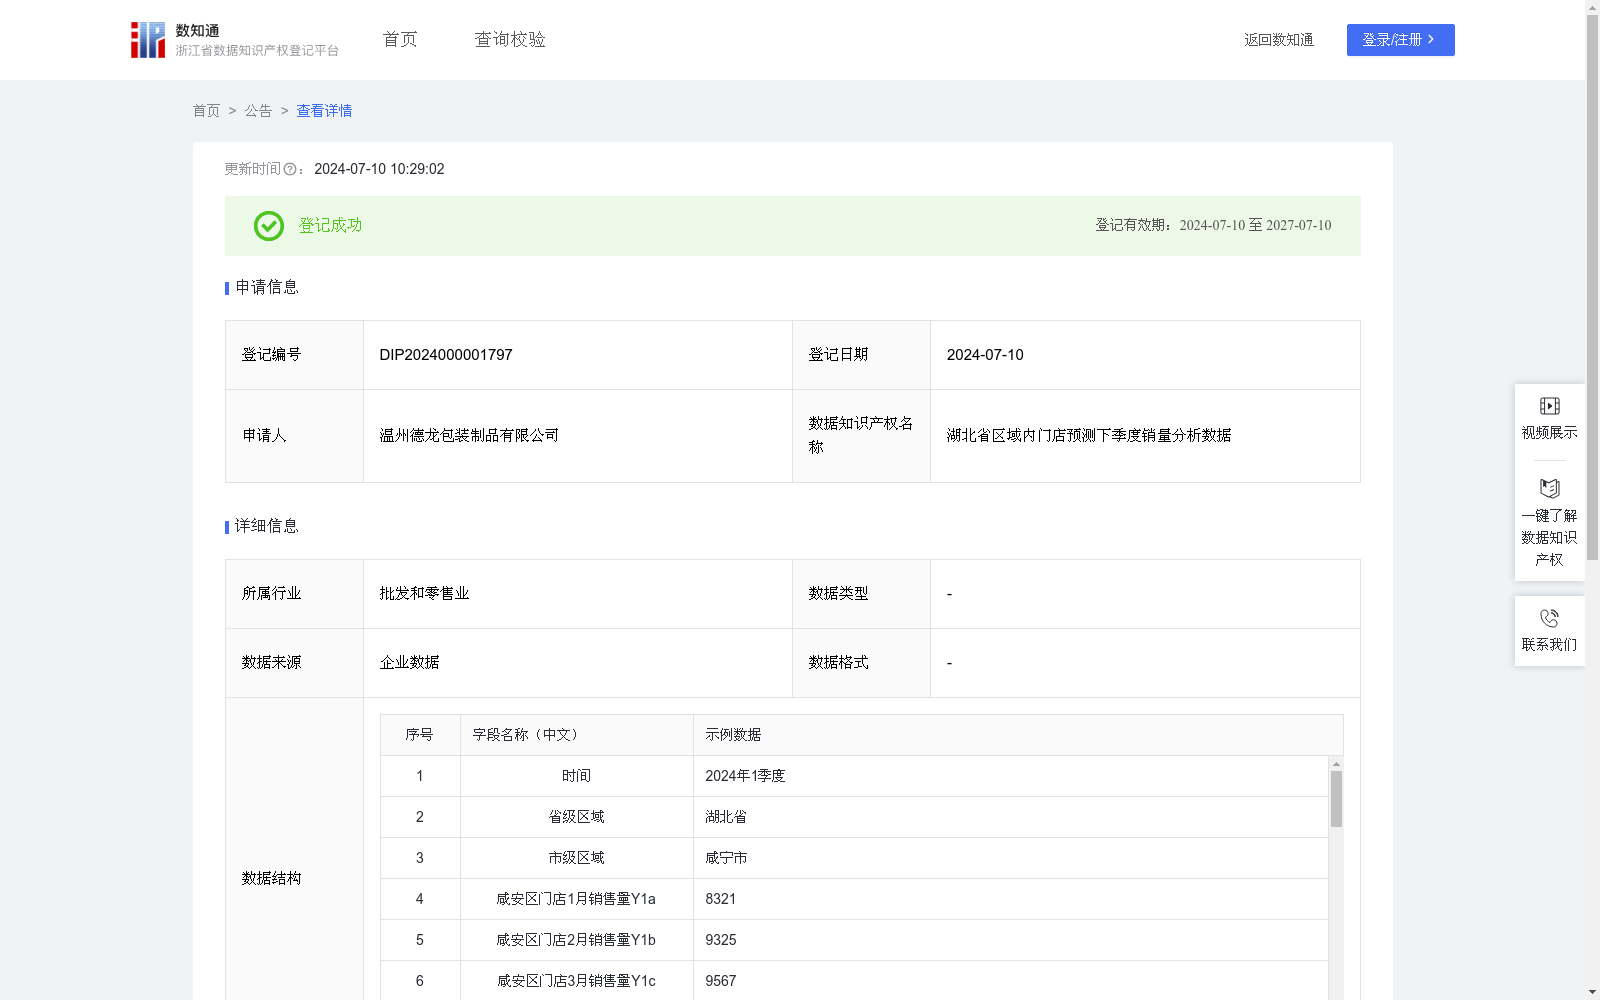
湖北省区域内门店预测下季度销量分析数据
收藏资源简介:
本单位在每一个市内的若干个区县开有终端门店用于销售塑料食品袋和纸盒(各市有不同数量的门店),每个市也均设置有一个仓库,通过每个终端门店上季度的销量,来预测到每个终端门店下季度的销量数据,总而得到该市下季度的总销量预测数据,对本单位可起到俩个作用:第一针对该市下季度的总销量预测数据M,本单位可以合理安排生产计划和调度资源,以确保按时交货并满足该市的市场供货需求。第二针对该市内的每个终端门店,Y1和M1、Y2和M2、Y3和M3等数据可以帮助本单位合理进行库存管理策略,在该市内进行合理的库存周转。数据采集:采集每天门店销量数据。2.数据处理:针对该市第一家门店,汇总该季度每个月的销量Y1a、Y1b、Y1c,以及该季度总销量Y1,对于第二家门店,汇总该季度每个月的销量Y2a、Y2b、Y2c,以及该季度总销量Y2,对于第n家门店,汇总该季度每个月销量Yna、Ynb、Ync,以及该季度总销量Yn。3.预计下季度销量:第一家门店下季度预测销量M1 = (Y1b/Y1a+Y1c/Y1b)*0.5*Y1(最终数值取整数),第二家门店下季度预测销量M2= (Y2b/Y2a+Y2c/Y2b)*0.5*Y2,针对该市内第n家门店,第n家门店下季度预测销量Mn= (Ynb/Yna+Ync/Ynb)*0.5*Yn。4.数据分析:上季度该市总销量Y=Y1+Y2+....Yn,下季度该市预测总销量M=M1+M2+....Mn,令P=M-Y,不同省份根据P值的不同采取不同生产计划和库存管理(因为不同的省份仓库库存量不同),如果P>6000,则可加大生产计划加大库存量;如果P<3000,则可减缓生产计划加小库存量;如果3000≤P≤6000则可保持原生产计划原库存量。
Our company operates terminal retail stores in multiple districts and counties under each municipal city for selling plastic food bags and paper cartons (each city has a varying number of stores), and one dedicated warehouse is set up for each municipal city. By leveraging the sales volume of each terminal store in the previous quarter, we forecast the next-quarter sales volume for each terminal store, thereby generating the total sales forecast data for the entire city in the next quarter. This forecast serves two key purposes for our enterprise: 1. Based on the total next-quarter sales forecast data M of the city, our company can reasonably arrange production plans and allocate resources to ensure on-time delivery and meet the local market supply demand. 2. For each terminal store within the city, data pairs such as Y1 and M1, Y2 and M2, Y3 and M3, etc., can assist the company in formulating rational inventory management strategies and implementing proper inventory turnover within the city. Data Collection: Collect daily sales data of all stores. 2. Data Processing: For the first store in the city, aggregate the monthly sales volumes Y1a, Y1b, Y1c for each month of the current quarter, as well as the total quarterly sales volume Y1. For the second store, aggregate the monthly sales volumes Y2a, Y2b, Y2c for each month of the current quarter, as well as the total quarterly sales volume Y2. For the nth store, aggregate the monthly sales volumes Yna, Ynb, Ync for each month of the current quarter, as well as the total quarterly sales volume Yn. 3. Next-Quarter Sales Forecast: The next-quarter forecast sales volume for the first store is M1 = (Y1b/Y1a + Y1c/Y1b) * 0.5 * Y1 (the final value is rounded to an integer). The next-quarter forecast sales volume for the second store is M2 = (Y2b/Y2a + Y2c/Y2b) * 0.5 * Y2. For the nth store in the city, the next-quarter forecast sales volume is Mn = (Ynb/Yna + Ync/Ynb) * 0.5 * Yn. 4. Data Analysis: The total previous-quarter sales volume of the city is Y = Y1 + Y2 + ... + Yn, and the total next-quarter forecast sales volume of the city is M = M1 + M2 + ... + Mn. Let P = M - Y. Different provinces will adopt distinct production plans and inventory management strategies based on the value of P, as the warehouse inventory levels vary across provinces. Specifically: - If P > 6000, expand production plans and increase inventory reserves; - If P < 3000, slow down production plans and reduce inventory reserves; - If 3000 ≤ P ≤ 6000, maintain the original production plans and inventory levels.