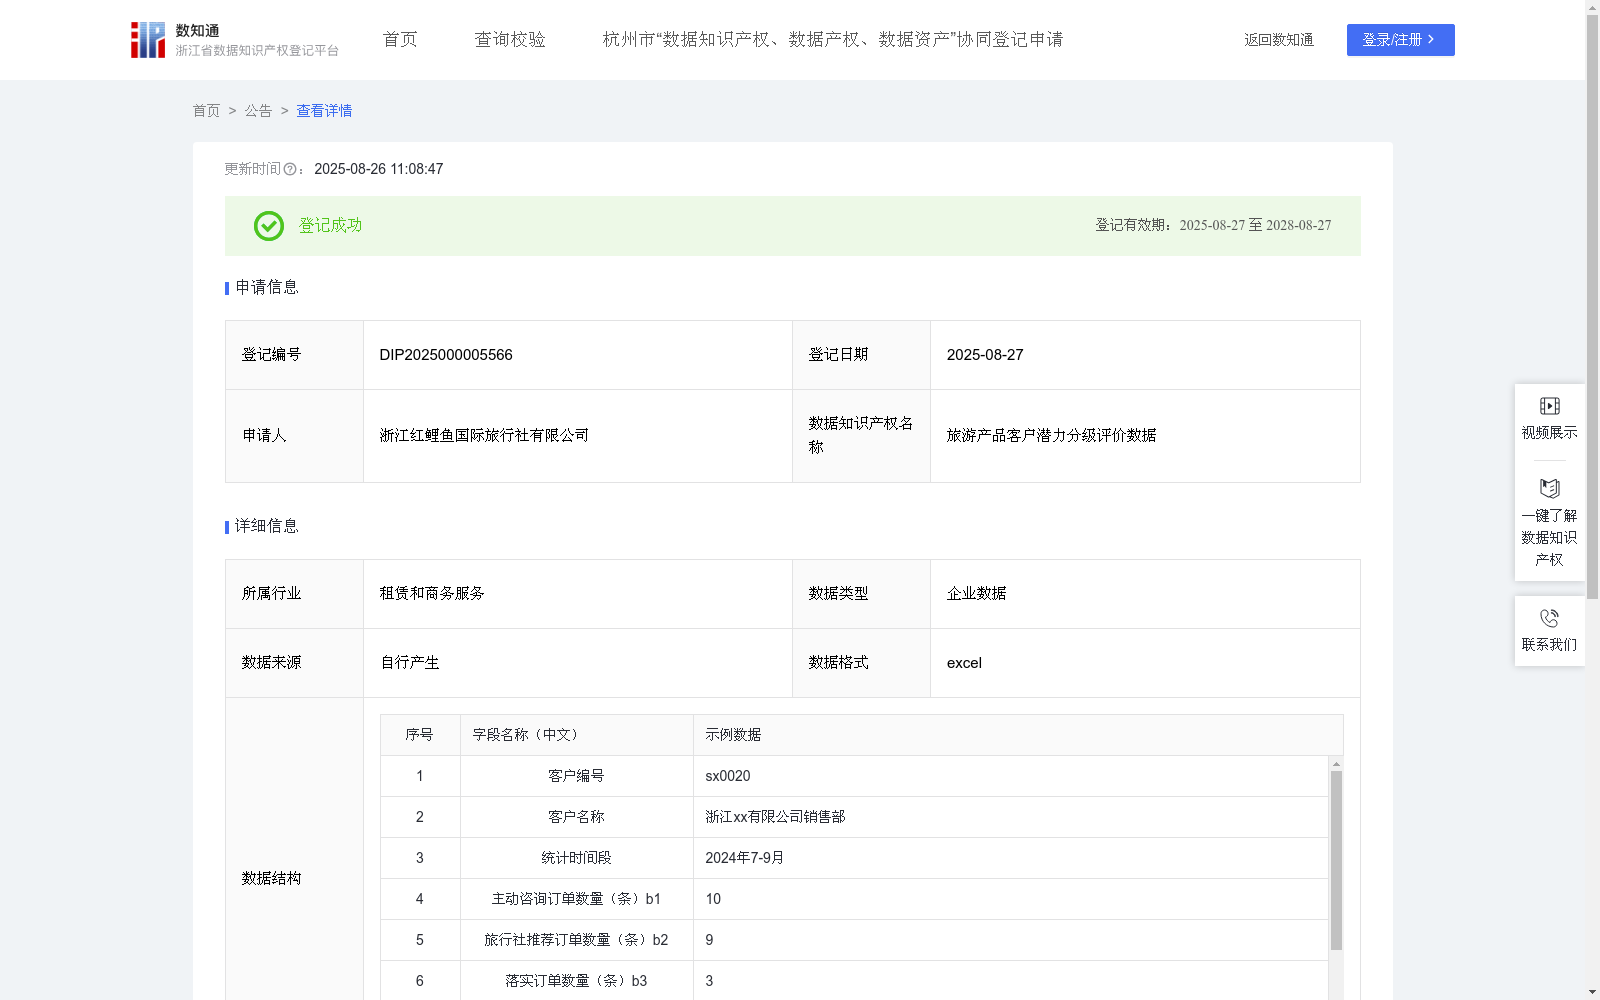
旅游产品客户潜力分级评价数据
收藏资源简介:
通过收集和分析客户对旅游线路的相关数据,了解客户对旅游线路的消费水平和消费偏好,推送给客人精准的旅游线路产品,从而避免了客户无休止的海量线路选择,为客户缩减了大量的时间和精力。通过客户需求量成长性分析,给客户划分高中低等级,给不同等级客户提供更精准的服务,通过精准推荐,旅游供给侧线路产品可以减少资源错配,一方面可以减少供应商的资源浪费,另一方面可以让客户获得‘懂我’的服务,实现双赢。1.数据采集:采集以往客户对旅行线路资源组合情况的相关咨询、推荐、落实和反馈需要改进的数据。 2.数据处理:对采集到数据进行分类、合并、累加、匹配。 3.算法加工:将处理后的整合数据进行需求量成长性分析:P={b3(落实订单数量)/b2(旅行社推荐订单数量)+b3(落实订单数量)/b1(主动咨询线路数量)}*b4(落实合同金额)*k,k为消费系数,不同省份系数大小值不同,按经验取值浙江省k值为0.8。 4.数据分类分级:根据计算出的需求量成长性P,将客户潜力等级划分为“高、中、低”不同的类别和级别(10以上标记为“高等级”,4-10区间内标记为“中等级”,4以下标记为“低等级”)。
By collecting and analyzing relevant data about customers' travel itineraries, this dataset aims to understand customers' consumption levels and preferences regarding travel products, and deliver precisely matched travel itinerary recommendations to them. This eliminates the need for customers to sift through overwhelming numbers of itinerary options, saving them substantial time and effort. Through analysis of customers' demand growth potential, customers are categorized into high, medium and low tiers to deliver more tailored services. Via precise recommendation, the travel supply side can reduce resource misallocation: on one hand, cutting down on supplier resource waste; on the other hand, enabling customers to receive personalized services that truly align with their needs, achieving a win-win situation. 1. Data Collection: Collect data covering inquiries, recommendations, finalized implementation, feedback and areas for improvement related to past customers' travel itinerary resource matching scenarios. 2. Data Processing: Classify, merge, aggregate and match the collected data. 3. Algorithm Processing: Conduct demand growth potential analysis on the processed integrated data using the following formula: P = [(b3 / b2) + (b3 / b1)] × b4 × k Where: b3 = Number of finalized orders, b2 = Number of orders recommended by travel agencies, b1 = Number of active itinerary inquiries, b4 = Contracted amount of finalized orders, k = Consumption coefficient, which varies across different provinces. According to empirical values, the coefficient for Zhejiang Province is 0.8. 4. Data Classification and Grading: Divide customer potential tiers into "High", "Medium" and "Low" based on the calculated demand growth potential P: customers with a P value greater than 10 are marked as "High Tier", those with a P value within the range of 4 to 10 (inclusive) are marked as "Medium Tier", and those with a P value below 4 are marked as "Low Tier".