theforecastingcompany/enedis-with-holidays
收藏资源简介:
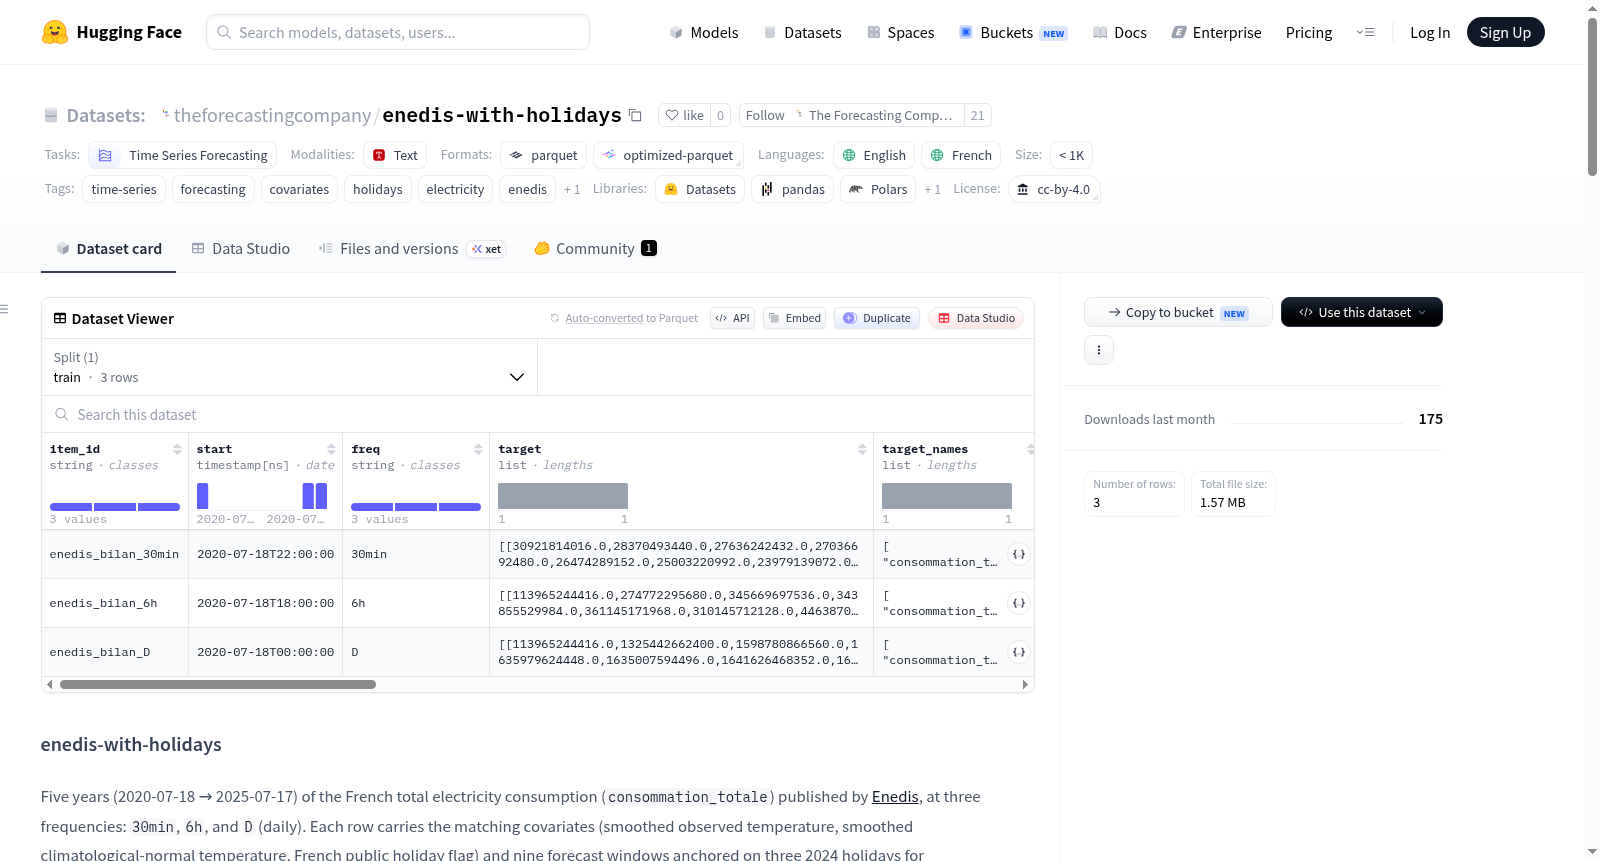
--- license: cc-by-4.0 language: - en - fr task_categories: - time-series-forecasting tags: - time-series - forecasting - covariates - holidays - electricity - enedis - france size_categories: - n<1K configs: - config_name: default data_files: - split: train path: data/train-* --- # enedis-with-holidays Five years (2020-07-18 → 2025-07-17) of the French total electricity consumption (`consommation_totale`) published by [Enedis](https://data.enedis.fr/), at three frequencies: `30min`, `6h`, and `D` (daily). Each row carries the matching covariates (smoothed observed temperature, smoothed climatological-normal temperature, French public holiday flag) and nine forecast windows anchored on three 2024 holidays for backtesting. This dataset is designed to **evaluate how well forecasting models capture holiday effects**. French public holidays cause large, predictable drops in electricity consumption that are notoriously hard to forecast with seasonality alone — Labour Day (May 1), Armistice (Nov 11), and the Christmas / New-Year cluster are all included explicitly, with multiple forecast-creation dates per holiday so you can compare model behaviour across short, medium, and long holiday lead times. The `is_france_holiday` future covariate is the hook for testing covariate-aware models against ones that have to infer the holiday calendar themselves. The half-hourly row preserves the raw cadence; the 6h and daily rows are time-bucket aggregations (sum for the energy target, mean for temperatures, max for the holiday indicator). Forecast windows are expressed in each row's own frequency units. ## Quickstart ```python from datasets import load_dataset ds = load_dataset("theforecastingcompany/enedis-with-holidays", split="train") for row in ds: print( row["item_id"], row["freq"], "T =", len(row["target"][0]), "targets =", len(row["target_names"]), "windows =", len(row["window_fcd_idxs"]), ) # enedis_bilan_30min 30min T = 87648 targets = 1 windows = 9 # enedis_bilan_6h 6h T = 7305 targets = 1 windows = 9 # enedis_bilan_D D T = 1827 targets = 1 windows = 9 ``` Ground truth for window `i` is: ```python fcd = row["window_fcd_idxs"][i] horizon = row["window_horizons"][i] ground_truth = np.array(row["target"])[:, fcd + 1 : fcd + 1 + horizon] # shape (1, horizon) ``` ## Rows | `item_id` | `freq` | T | targets | past covs | future covs | windows | | -------------------- | ------- | ------ | ------- | --------- | ----------- | ------- | | `enedis_bilan_30min` | `30min` | 87 648 | 1 | 1 | 2 | 9 | | `enedis_bilan_6h` | `6h` | 7 305 | 1 | 1 | 2 | 9 | | `enedis_bilan_D` | `D` | 1 827 | 1 | 1 | 2 | 9 | All three rows start at `2020-07-18` and end at `2025-07-17` (modulo each frequency's bucketing). The post-2024-10-04 15-min era in the raw Enedis data is aggregated to 30-min mean before the half-hourly row is emitted, so the timeline is uniform across the five-year span. ## Schema | field | type | meaning | | ------------------------------ | ---------------------------------------- | ------------------------------------------------------------------------------------------------ | | `item_id` | `string` | row id, encoding the frequency | | `start` | `timestamp[ns]` | timestamp of `target[:, 0]` | | `freq` | `string` | pandas freq alias (`30min`, `6h`, `D`) | | `target` | `Sequence(Sequence(float32))` `(D_t, T)` | target — single channel (`consommation_totale`); always 2-D with `D_t = 1` | | `target_names` | `Sequence(string)`, length 1 | always `["consommation_totale"]` | | `past_feat_dynamic_real` | `Sequence(Sequence(float32))` `(D_h, T)` | history-only covariates — 1 channel | | `past_feat_dynamic_real_names` | `Sequence(string)`, length 1 | | | `feat_dynamic_real` | `Sequence(Sequence(float32))` `(D_f, T)` | known-future covariates — 2 channels | | `feat_dynamic_real_names` | `Sequence(string)`, length 2 | | | `window_fcd_idxs` | `Sequence(int32)`, length 9 | i-th window: index of last observed step on the target axis | | `window_horizons` | `Sequence(int32)`, length 9 | i-th window: number of future steps to forecast | | `source` | `string` | provenance | | `source_item_id` | `string` | original id in the source data | ### Target - `consommation_totale` — total French electricity consumption, expressed as **energy delivered during the bucket in Wh**. At daily granularity the value is the total daily energy (≈ 1.2–1.5 TWh per day for France). Always exposed as a 2-D `(1, T)` array so the schema accommodates future multivariate versions without an API break. ### Covariates - **`past_feat_dynamic_real`** (history-only) - `temperature_reelle_lissee` — smoothed observed temperature (°C). - **`feat_dynamic_real`** (known-future) - `is_france_holiday` — binary, 1 on French public holidays. - `temperature_normale_lissee` — smoothed climatological-normal temperature (°C). For the 6h and daily rows: the consumption channel is the **sum** over the bucket (so units stay in Wh of delivered energy per bucket); the holiday flag is the **max** (any holiday inside marks the whole bucket); temperatures are bucket **means**. ## Forecast windows Nine windows = three holidays × three forecast-creation dates each. The FCDs sit 20 / 10 / 5 days before each holiday and the matched horizons extend through the holiday window. The Christmas–New-Year cluster uses longer horizons (28 / 18 / 13 days) so the forecast also covers New Year's Day. | holiday | date | FCDs (days before) | horizons (days) | | --------------------- | ------------ | ------------------ | --------------- | | Labour Day | 2024-05-01 | 20, 10, 5 | 20, 10, 5 | | Armistice | 2024-11-11 | 20, 10, 5 | 20, 10, 5 | | Christmas / New Year | 2024-12-25 | 28, 18, 13 | 28, 18, 13 | In each row the FCD indexes and horizons are expressed in steps of that row's frequency (so the `30min` row's `window_horizons` are in half-hours, the `6h` row's are in six-hour buckets, etc.). ## Source & license Built from the *bilan électrique demi-heure* series published by [Enedis Open Data](https://data.enedis.fr/) and mirrored on [data.gouv.fr](https://www.data.gouv.fr/fr/datasets/bilan-electrique-demi-heure/). The covariates are publicly available French public-holiday calendars and Météo-France smoothed temperature references. Redistributed under [CC-BY-4.0](https://creativecommons.org/licenses/by/4.0/) with credit to Enedis as the upstream data provider. ## Citation If you use this dataset, please credit Enedis as the upstream data provider and link back to this Hub repository.
Five years (2020-07-18 → 2025-07-17) of the French total electricity consumption (`consommation_totale`) published by Enedis, at three frequencies: `30min`, `6h`, and `D` (daily). Each row carries the matching covariates (smoothed observed temperature, smoothed climatological-normal temperature, French public holiday flag) and nine forecast windows anchored on three 2024 holidays for backtesting. This dataset is designed to evaluate how well forecasting models capture holiday effects. French public holidays cause large, predictable drops in electricity consumption that are notoriously hard to forecast with seasonality alone — Labour Day (May 1), Armistice (Nov 11), and the Christmas / New-Year cluster are all included explicitly, with multiple forecast-creation dates per holiday so you can compare model behaviour across short, medium, and long holiday lead times. The `is_france_holiday` future covariate is the hook for testing covariate-aware models against ones that have to infer the holiday calendar themselves.