印度洋热带气旋及降雨对流个例样本特征数据集(1978-2019;2000-2019)
收藏国家青藏高原科学数据中心2021-04-19 更新2024-03-01 收录
下载链接:
https://data.tpdc.ac.cn/zh-hans/data/2058f185-cfe6-4426-9c58-f4f72b2b803c
下载链接
链接失效反馈官方服务:
资源简介:
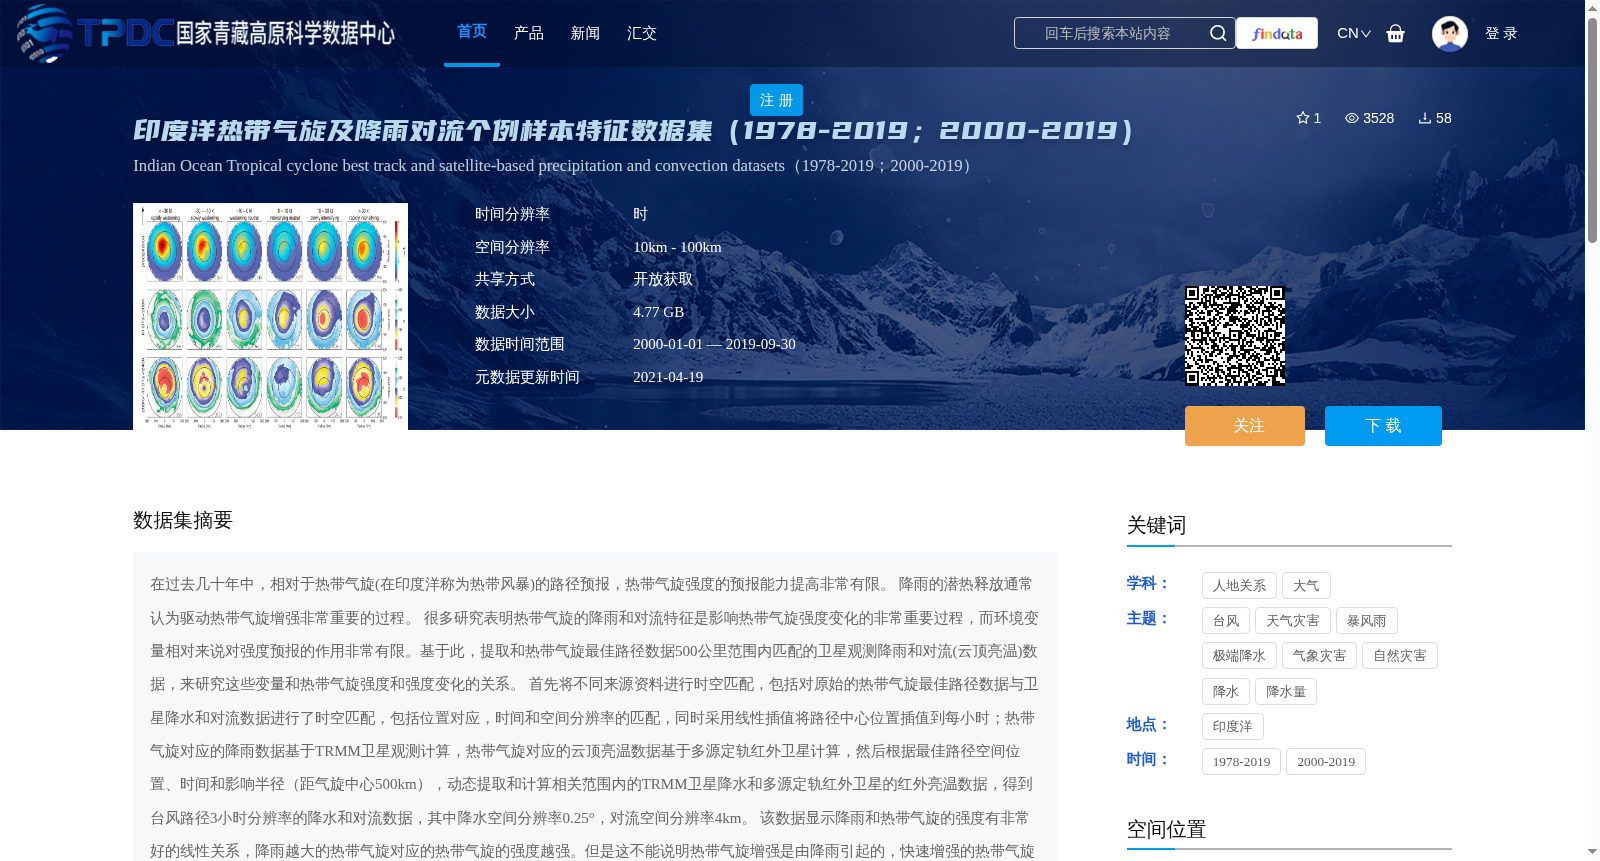
在过去几十年中,相对于热带气旋(在印度洋称为热带风暴)的路径预报,热带气旋强度的预报能力提高非常有限。 降雨的潜热释放通常认为驱动热带气旋增强非常重要的过程。 很多研究表明热带气旋的降雨和对流特征是影响热带气旋强度变化的非常重要过程,而环境变量相对来说对强度预报的作用非常有限。基于此,提取和热带气旋最佳路径数据500公里范围内匹配的卫星观测降雨和对流(云顶亮温)数据,来研究这些变量和热带气旋强度和强度变化的关系。
首先将不同来源资料进行时空匹配,包括对原始的热带气旋最佳路径数据与卫星降水和对流数据进行了时空匹配,包括位置对应,时间和空间分辨率的匹配,同时采用线性插值将路径中心位置插值到每小时;热带气旋对应的降雨数据基于TRMM卫星观测计算,热带气旋对应的云顶亮温数据基于多源定轨红外卫星计算,然后根据最佳路径空间位置、时间和影响半径(距气旋中心500km),动态提取和计算相关范围内的TRMM卫星降水和多源定轨红外卫星的红外亮温数据,得到台风路径3小时分辨率的降水和对流数据,其中降水空间分辨率0.25°,对流空间分辨率4km。
该数据显示降雨和热带气旋的强度有非常好的线性关系,降雨越大的热带气旋对应的热带气旋的强度越强。但是这不能说明热带气旋增强是由降雨引起的,快速增强的热带气旋和快速减弱的热带气旋对应的降雨都可以很强。热带气旋从快速减弱到快速增强,深对流云(云顶亮温<208 K)的强度和面积都逐步增大,而与热带气旋的强度没有线性的对应关系。这一部分深对流云的变化领先于热带气旋强度24小时变化, 因此可以作为判断热带气旋强度变化非常重要的指标(Ruan and Wu,2018,GRL)。与热带气旋相对应的降雨和对流特征,可以很好的用来研究热带气旋强度以及强度变化。同时,该数据的降雨具有3小时的分辨率,云顶温度具有半小时的分辨率, 可以做日变化尺度上的相关研究。
Over the past few decades, the predictive capability of tropical cyclone (TC) intensity has improved only very limitedly, compared with that of TC track forecasting (known as tropical storms in the Indian Ocean). Latent heat release from rainfall is generally recognized as a critically important process driving the intensification of tropical cyclones. Numerous studies have demonstrated that rainfall and convective characteristics of TCs are significantly influential processes governing TC intensity changes, whereas environmental variables play a relatively limited role in intensity forecasting. Against this backdrop, satellite-observed rainfall and convective (cloud-top brightness temperature, CBT) data matched within a 500-kilometer radius of TC best-track data were extracted to investigate the relationships between these variables and TC intensity as well as its changes.
First, spatio-temporal matching was performed for multi-source datasets: specifically, spatio-temporal alignment was conducted between the original TC best-track data and satellite precipitation and convective data, including matching of positions, temporal and spatial resolutions, and linear interpolation was applied to interpolate the track center positions to hourly intervals. Rainfall data corresponding to TCs were calculated based on observations from the Tropical Rainfall Measuring Mission (TRMM) satellite, while cloud-top brightness temperature data for TCs were computed using data from multi-source orbital infrared satellites. Subsequently, based on the spatial positions, times, and influence radius (500 km from the TC center) of the best-track data, TRMM satellite precipitation and multi-source orbital infrared satellite infrared brightness temperature data within the relevant range were dynamically extracted and calculated, yielding precipitation and convective data with a 3-hour resolution along the TC track, where the precipitation has a spatial resolution of 0.25° and the convective data has a spatial resolution of 4 km.
This dataset reveals a strong linear correlation between rainfall and TC intensity: TCs with heavier rainfall correspond to higher intensity. However, this does not imply that TC intensification is caused by rainfall, as both rapidly intensifying and rapidly weakening TCs can exhibit high rainfall amounts. As TCs transition from rapid weakening to rapid intensification, the intensity and area of deep convective clouds (with cloud-top brightness temperature < 208 K) gradually increase, while no linear correlation exists between these parameters and TC intensity. Changes in this subset of deep convective clouds precede the 24-hour variations in TC intensity, thus serving as a critically important indicator for judging TC intensity changes (Ruan and Wu, 2018, Geophysical Research Letters (GRL)). Rainfall and convective characteristics corresponding to TCs can be effectively used to investigate TC intensity and its changes. Additionally, the rainfall data in this dataset has a 3-hour temporal resolution, while the cloud-top temperature data has a 30-minute resolution, enabling correlational studies at the diurnal variation scale.
提供机构:
吴巧燕
创建时间:
2020-12-14
搜集汇总
数据集介绍
背景与挑战
背景概述
该数据集聚焦印度洋热带气旋(1978-2019;2000-2019),通过整合热带气旋最佳路径数据与卫星观测的降雨和对流数据(覆盖气旋中心500公里范围),旨在研究降雨、对流特征与气旋强度变化的关系。数据包括北印度洋和南印度洋的个例样本,提供每小时分辨率的气旋路径信息、3小时分辨率的降水数据(0.25°空间分辨率)以及半小时分辨率的云顶亮温数据(4km空间分辨率),适用于热带气旋强度预报和日变化尺度研究。
以上内容由遇见数据集搜集并总结生成


