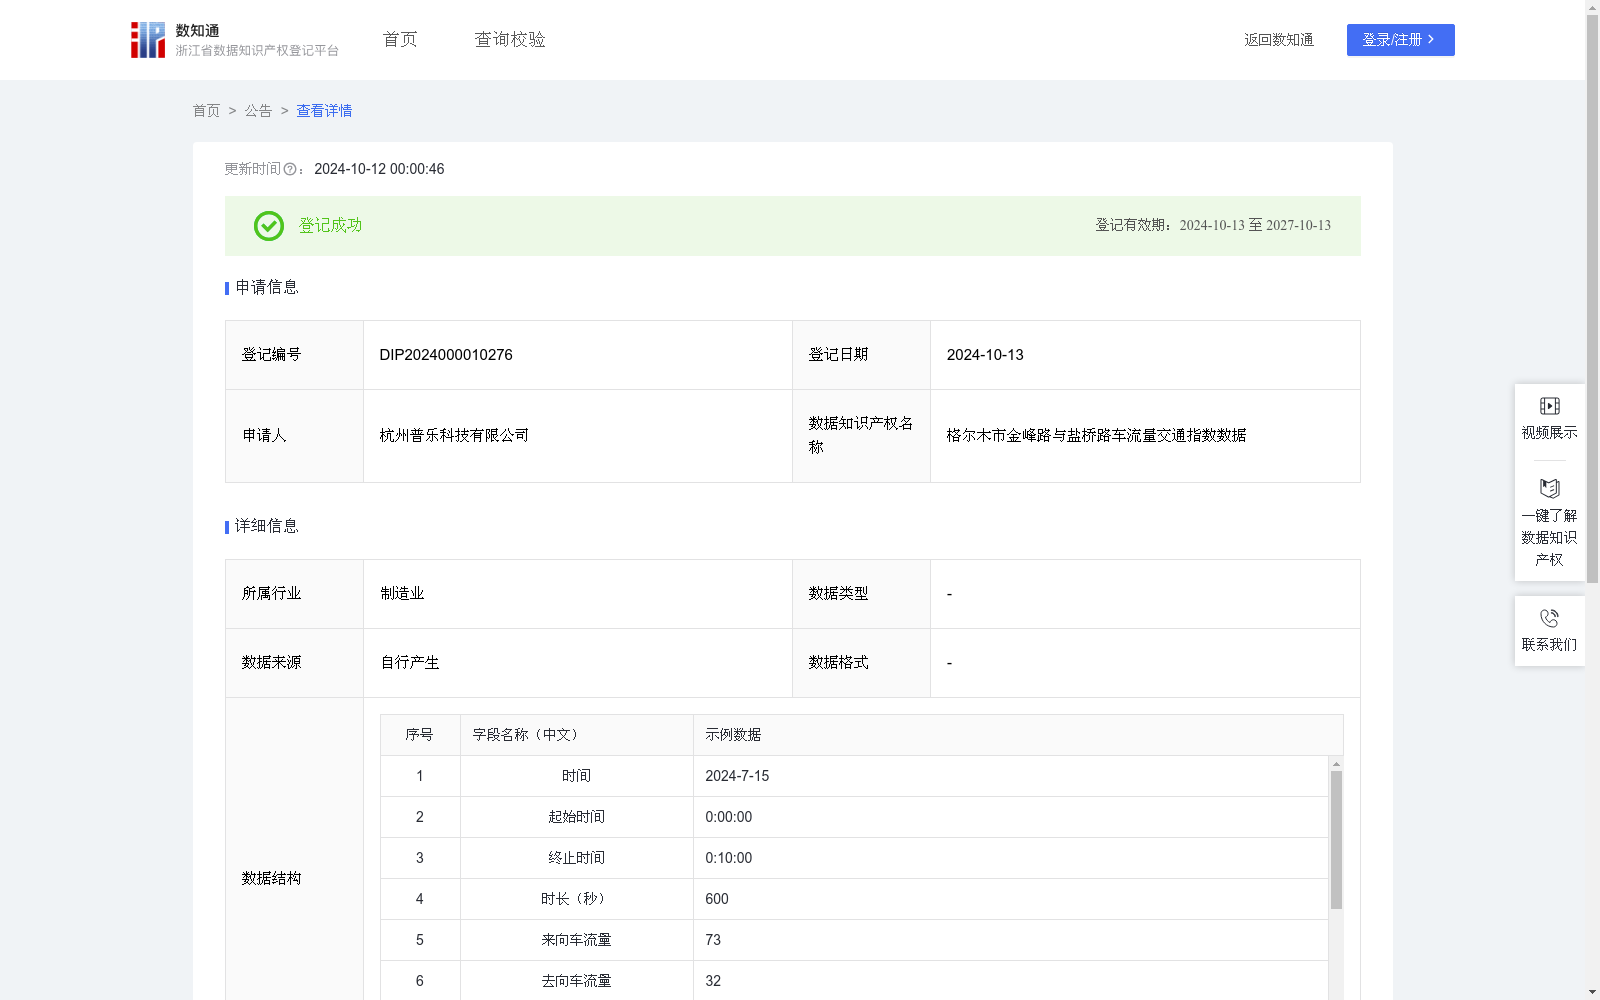
格尔木市金峰路与盐桥路车流量交通指数数据
收藏浙江省数据知识产权登记平台2024-10-12 更新2024-10-12 收录
下载链接:
https://www.zjip.org.cn/home/announce/trends/69992
下载链接
链接失效反馈官方服务:
资源简介:
主要包括金峰路与盐桥路路口车各方向流量数据由车辆进出检测区域统计而来,根据进出数据控制交通信号的实时调度。用途:1. 为实现后期重新划分时段,调整时段时间以及当前时段绿信比(指信号灯周期内可用于车辆通行的绿灯时间与整个周期时间的比例)提供原始数据;1)工作日周二~周四:根据各方向前两天车流量数据,与路口设计饱和流量值比值,分区段划分时段;2)工作日周一和周五~周日:根据各方向前两周周一当天车流量数据,与路口设计饱和流量值比值,分区段划分时段;2. 根据各时间段流量,可计算车道时间占有率,并可估算车道空间占有率和车头时距;3. 提供交通部门决策所需的路口交通流量,车道占有率等数据。1.数据来源:①交通流量(即流量检测线圈的车辆总和):去向、左转、直行等可通过软件后台监测收集得到,来向需通过测算得到;②饱和流量(即10分钟最大能通过的数量):根据以往测算可知,为固定值。③来向、去向交通指数需通过计算。 2.数据处理及应用:来向交通流量(a1)=左转交通流量(a3)+直行交通流量(a4)+右转交通流量(a5);去向交通流量(a2);来向交通指数=a1/1476*X;去向交通指数=a2/776*X(X指数区间值为1-3之间) ,当来向交通指数和去向交通指数小于等于3时,车流量属于正常范围,当来向交通指数和去向交通指数大于3以上时,需要根据不同路段和不同时间段来进行分析判断车流量是否拥堵,从而优化红绿灯时间提供参考依据,提高通行效率,从而可持续发展。
This dataset mainly includes traffic flow data of each direction at the intersection of Jinfeng Road and Yanqiao Road. The data is collected by counting vehicles entering and exiting the detection zone, and is used to control real-time scheduling of traffic signals based on the entry and exit data.
### Applications
1. Provide raw data for the subsequent work of re-dividing time periods, adjusting period durations and the current green split (defined as the ratio of the green time available for vehicle passage to the total cycle time of the traffic signal):
1) For workdays from Tuesday to Thursday: Divide time periods into sections based on the ratio of the traffic flow data of each direction from the previous two days to the designed saturated flow of the intersection;
2) For workdays on Monday, Friday, Saturday and Sunday: Divide time periods into sections based on the ratio of the traffic flow data of each direction on the Monday of the previous two weeks to the designed saturated flow of the intersection;
2. Calculate lane time occupancy based on the flow data of each time period, and estimate lane space occupancy and headway;
3. Provide traffic data such as intersection traffic flow and lane occupancy required for traffic department decision-making.
### Data Sources
1. Traffic flow (i.e., the total number of vehicles detected by flow detection loops): The outflow, left-turn, straight-going and other flows can be collected through software background monitoring, while the inflow needs to be obtained through calculation;
2. Saturated flow (i.e., the maximum number of vehicles that can pass within 10 minutes): It is a fixed value confirmed by previous calculations;
3. Inflow and outflow traffic indices need to be calculated.
### Data Processing and Application
The inflow traffic flow (a1) = left-turn traffic flow (a3) + straight-going traffic flow (a4) + right-turn traffic flow (a5); Outflow traffic flow (a2);
Inflow traffic index = (a1 / 1476) * X; Outflow traffic index = (a2 / 776) * X (the value range of X is 1 to 3). When the inflow and outflow traffic indices are ≤ 3, the traffic flow is within the normal range. When the indices exceed 3, it is necessary to analyze and judge whether there is traffic congestion based on different road sections and time periods, so as to provide reference for optimizing traffic light timing, improve traffic efficiency and promote sustainable development.
提供机构:
杭州普乐科技有限公司
创建时间:
2024-09-27
搜集汇总
数据集介绍
以上内容由遇见数据集搜集并总结生成


