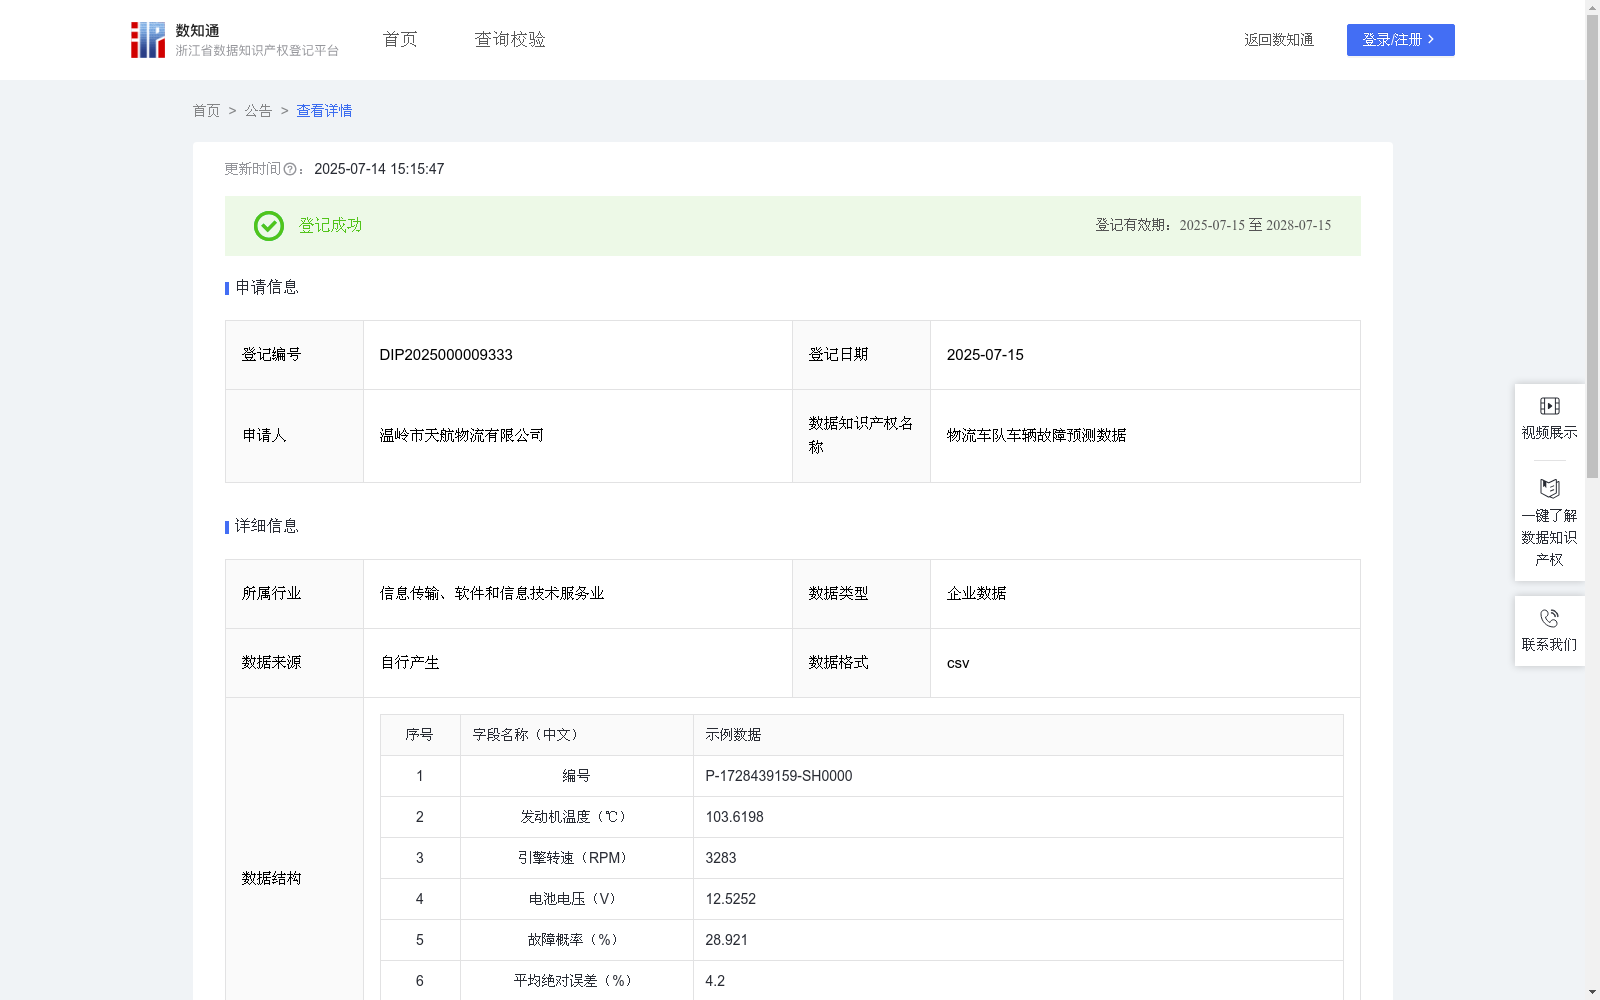
物流车队车辆故障预测数据
收藏浙江省数据知识产权登记平台2025-07-14 更新2025-07-15 收录
下载链接:
https://www.zjip.org.cn/home/announce/trends/148593
下载链接
链接失效反馈官方服务:
资源简介:
该数据在物流车队车辆故障预测中具有重要的应用价值。能够提供自动化故障预警,更精确地判断潜在故障风险,帮助运维人员进行提前维护与调度。在智能车辆管理系统中具有广泛的应用场景,特别是在物流车队运营监控、自动驾驶车辆健康检测和公共交通车辆维护管理中,能够提高车辆运行安全性,降低故障维修成本,提供智能化的维修决策支持。数据收集:
本系统依赖于车辆前装传感器数据和历史故障记录数据。每条记录的编号唯一对应一个采样时间点的车辆状态数据。传感器采集的特征包括发动机温度(单位为摄氏度)、引擎转速(单位为转每分钟)、电池电压(单位为伏特)等实时运行参数。目标输出为故障概率(以百分比表示),用于评估当前状态下出现故障的风险。模型效果评价指标为平均绝对误差和AUC值,用于衡量预测准确性与分类能力。
数据预处理:
所有输入特征在进入模型之前进行标准化处理,使其均值为0,标准差为1,以加速模型训练并提高稳定性。异常值(如发动机温度超过安全阈值150℃或电压小于9V)将被识别为异常样本并剔除。为了增强模型泛化能力,还对部分历史样本进行SMOTE过采样处理,平衡正负样本数量。最终数据集按时间切分为训练集与测试集,避免未来信息泄露。
模型构建:
本系统采用深度前馈神经网络(Feedforward Deep Neural Network)架构,包含三个隐藏层,每层使用ReLU激活函数。网络输入为三维特征向量,包括发动机温度、引擎转速和电池电压;输出为当前车辆状态对应的故障概率预测值。
模型的核心运算过程如下:特征转换层:H = ReLU(W₁ × X + b₁)。其中,X为输入向量,包含发动机温度、引擎转速、电池电压;W₁和b₁为第一层的权重和偏置;ReLU为修正线性单元函数,H为隐层特征表示。故障概率输出:P̂ = Sigmoid(W₂ × H + b₂) × 100。其中,P̂为故障概率(百分比),W₂和b₂为输出层参数,Sigmoid函数将结果映射至[0,1]区间,并乘以100转为百分比输出。模型性能通过以下两个指标评估:平均绝对误差(MAE) = 平均值(|P̂ - P|)。AUC值(Area Under Curve)表示在所有正负样本中,正确排序的概率,值越接近1表示模型性能越优。其中,P为实际故障概率(从历史标签中得出),P̂为模型预测结果。
This dataset holds significant application value in vehicle fault prediction for logistics fleets. It enables automated fault early warning, more accurate assessment of potential fault risks, and assists maintenance personnel in conducting proactive maintenance and scheduling. It has a wide range of application scenarios in intelligent vehicle management systems, particularly in logistics fleet operation monitoring, autonomous vehicle health detection, and public transport vehicle maintenance management. It can improve vehicle operation safety, reduce fault maintenance costs, and provide intelligent maintenance decision support.
Data Collection:
This system relies on pre-installed vehicle sensor data and historical fault record data. Each record's unique number corresponds to vehicle state data at a single sampling time point. The features collected by sensors include real-time operating parameters such as engine temperature (unit: degrees Celsius), engine speed (unit: revolutions per minute), and battery voltage (unit: volt). The target output is the fault probability (expressed as a percentage) for evaluating the risk of fault occurrence under the current state. The model performance evaluation metrics are Mean Absolute Error (MAE) and Area Under the Curve (AUC), which are used to measure prediction accuracy and classification capability.
Data Preprocessing:
All input features are standardized before being fed into the model to have a mean of 0 and a standard deviation of 1, so as to accelerate model training and improve stability. Outliers (such as engine temperature exceeding the safety threshold of 150°C or voltage less than 9V) will be identified as abnormal samples and removed. To enhance the model's generalization ability, SMOTE oversampling is performed on some historical samples to balance the number of positive and negative samples. The final dataset is split into training and test sets by time to avoid future data leakage.
Model Construction:
This system adopts a Feedforward Deep Neural Network architecture, which includes three hidden layers, with the ReLU activation function applied to each layer. The network input is a three-dimensional feature vector including engine temperature, engine speed, and battery voltage; the output is the predicted fault probability value corresponding to the current vehicle state.
The core computational process of the model is as follows:
Feature transformation layer: $H = ext{ReLU}(W_1 imes X + b_1)$. Here, $X$ is the input vector containing engine temperature, engine speed, and battery voltage; $W_1$ and $b_1$ are the weights and bias of the first layer; ReLU is the Rectified Linear Unit activation function, and $H$ is the hidden layer feature representation.
Fault probability output: $hat{P} = ext{Sigmoid}(W_2 imes H + b_2) imes 100$. Here, $hat{P}$ is the fault probability (in percentage), $W_2$ and $b_2$ are the parameters of the output layer, and the Sigmoid function maps the result to the interval [0, 1], which is then multiplied by 100 to convert it to a percentage output.
The model performance is evaluated using the following two metrics:
1. Mean Absolute Error (MAE) = $ ext{Average}(|hat{P} - P|)$.
2. Area Under the Curve (AUC) represents the probability of correct ranking among all positive and negative samples. The closer the value is to 1, the better the model performance. Here, $P$ is the actual fault probability (derived from historical labels), and $hat{P}$ is the model's prediction result.
提供机构:
温岭市天航物流有限公司
创建时间:
2025-06-25
搜集汇总
数据集介绍
背景与挑战
背景概述
该数据集为物流车队车辆故障预测数据,包含2254条记录,涵盖发动机温度、引擎转速、电池电压等关键指标,用于预测车辆故障概率,支持智能维修决策。数据采用深度前馈神经网络模型,评估指标包括平均绝对误差和AUC值,适用于物流车队运营监控和车辆维护管理。
以上内容由遇见数据集搜集并总结生成


