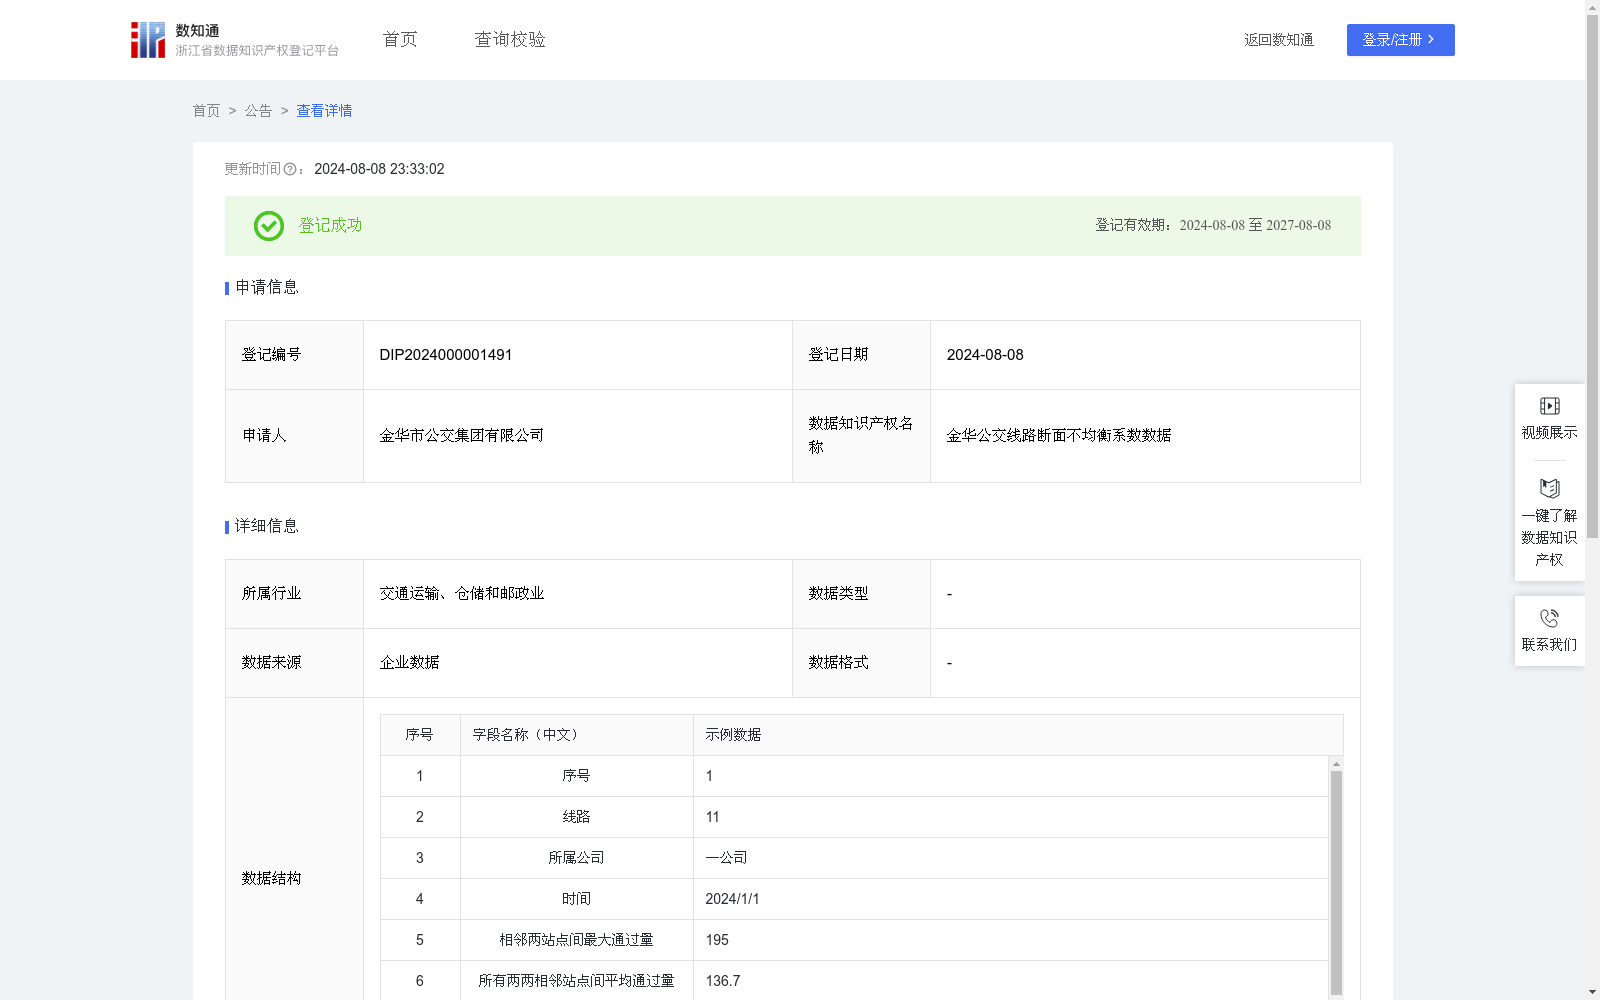
金华公交线路断面不均衡系数数据
收藏浙江省数据知识产权登记平台2024-08-08 更新2024-08-09 收录
下载链接:
https://www.zjip.org.cn/home/announce/trends/48677
下载链接
链接失效反馈官方服务:
资源简介:
公交断面不均衡系数是一个用来衡量在特定时间段内,城市公共交通系统中,各断面客流量分布不均衡程度的指标。它反映了公交线路或轨道交通线路上,不同区段的客流差异情况。可以根据断面不均衡系数来调整运营策略,如在客流高峰时段增加发车频率,或在客流较少的时段减少发车,以提高运营效率;还可以识别出哪些区域的客流量较高,从而优化线路布局,增加或调整公交车辆的投放,满足不同区域的客流需求。1、算法规则:相邻两站点间最大通过量、所有两两相邻站点间平均通过量为公交车站点客流量统计,数据来源于算法层面的od明细(线路站点排序与站点客流量数据),即在“金华市线网分析平台”中,通过筛选线路走向、所属公司、时间范围(月份),系统算法会自动计算出相应的断面不均衡系数(计算公式=相邻两站点间最大通过量/所有两两相邻站点间平均通过量)。2、数据评价:均衡客流分布:如果断面不均衡系数和时间不均衡系数的值接近1,表示客流分布相对均衡。轻度不均衡客流分布:如果系数值在1.2到1.5之间,表示客流分布存在一定程度的不均衡,但仍然在可接受范围内;中度不均衡客流分布:如果系数值在1.5到2.0之间,表示客流分布较为不均衡,可能需要采取措施来优化线路或调整运营策略;高度不均衡客流分布:如果系数值超过2.0,表示客流分布高度不均衡,迫切需要进行线路调整或增加运力来改善服务水平。3、数据应用:利用可视化工具,如图表和地图,直观展示不同线路在不同时间周期下的断面不均衡系数,分析断面不均衡系数,如果该系数接近1,表示客流分布相对均衡;如果该系数远大于1,表示客流在某断面高度集中,而在其他断面相对较少。
The public transport section imbalance coefficient is an indicator used to measure the uneven distribution of passenger flow across different sections of an urban public transit system within a specific time period. It reflects the disparity in passenger flow between different sections of bus or rail transit lines. Operational strategies can be adjusted based on this coefficient: for example, increasing service frequency during peak passenger flow hours or reducing it during off-peak periods to improve operational efficiency. Additionally, it can identify high-passenger-flow areas, thereby optimizing route layouts and increasing or adjusting bus fleet deployments to meet passenger flow demands in different regions.
1. Algorithm Rules: The passenger flow statistics at bus stops are based on the maximum passenger throughput between two adjacent stops and the average passenger throughput between all pairs of adjacent stops. The data is sourced from origin-destination (OD) details at the algorithm level, including route stop sequence and stop passenger flow data. Specifically, on the "Jinhua City Transit Network Analysis Platform", by filtering the route direction, affiliated company, and time range (month), the system's algorithm will automatically calculate the corresponding section imbalance coefficient, with the calculation formula = maximum passenger throughput between two adjacent stops / average passenger throughput between all pairs of adjacent stops.
2. Data Evaluation:
Balanced passenger flow distribution: If the values of the section imbalance coefficient and the temporal imbalance coefficient are close to 1, it indicates a relatively balanced passenger flow distribution.
Slightly uneven passenger flow distribution: If the coefficient value is between 1.2 and 1.5, it indicates a certain degree of uneven passenger flow distribution, but it is still within an acceptable range;
Moderately uneven passenger flow distribution: If the coefficient value is between 1.5 and 2.0, it indicates a relatively uneven passenger flow distribution, and measures may need to be taken to optimize routes or adjust operational strategies;
Highly uneven passenger flow distribution: If the coefficient value exceeds 2.0, it indicates a highly uneven passenger flow distribution, and urgent route adjustments or increased service capacity are required to improve service quality.
3. Data Application: Use visualization tools such as charts and maps to intuitively display the section imbalance coefficients of different routes across different time periods. When analyzing the section imbalance coefficient, if the coefficient is close to 1, it indicates a relatively balanced passenger flow distribution; if the coefficient is much greater than 1, it indicates that passenger flow is highly concentrated at a certain section and relatively low at other sections.
提供机构:
金华市公交集团有限公司
创建时间:
2024-05-28
搜集汇总
数据集介绍
特点
该数据集提供了金华市公交线路的断面不均衡系数数据,包含999条记录,每日更新。数据用于分析公交线路的客流分布情况,帮助优化公交运营策略和线路布局。
以上内容由遇见数据集搜集并总结生成


