海河流域多尺度地表通量与气象要素观测数据集:馆陶站-涡动相关仪(2008-2010)
收藏国家青藏高原科学数据中心2019-09-17 更新2024-03-01 收录
下载链接:
https://data.tpdc.ac.cn/zh-hans/data/78ecf659-e358-43ec-8de1-e40e3aca29da
下载链接
链接失效反馈官方服务:
资源简介:
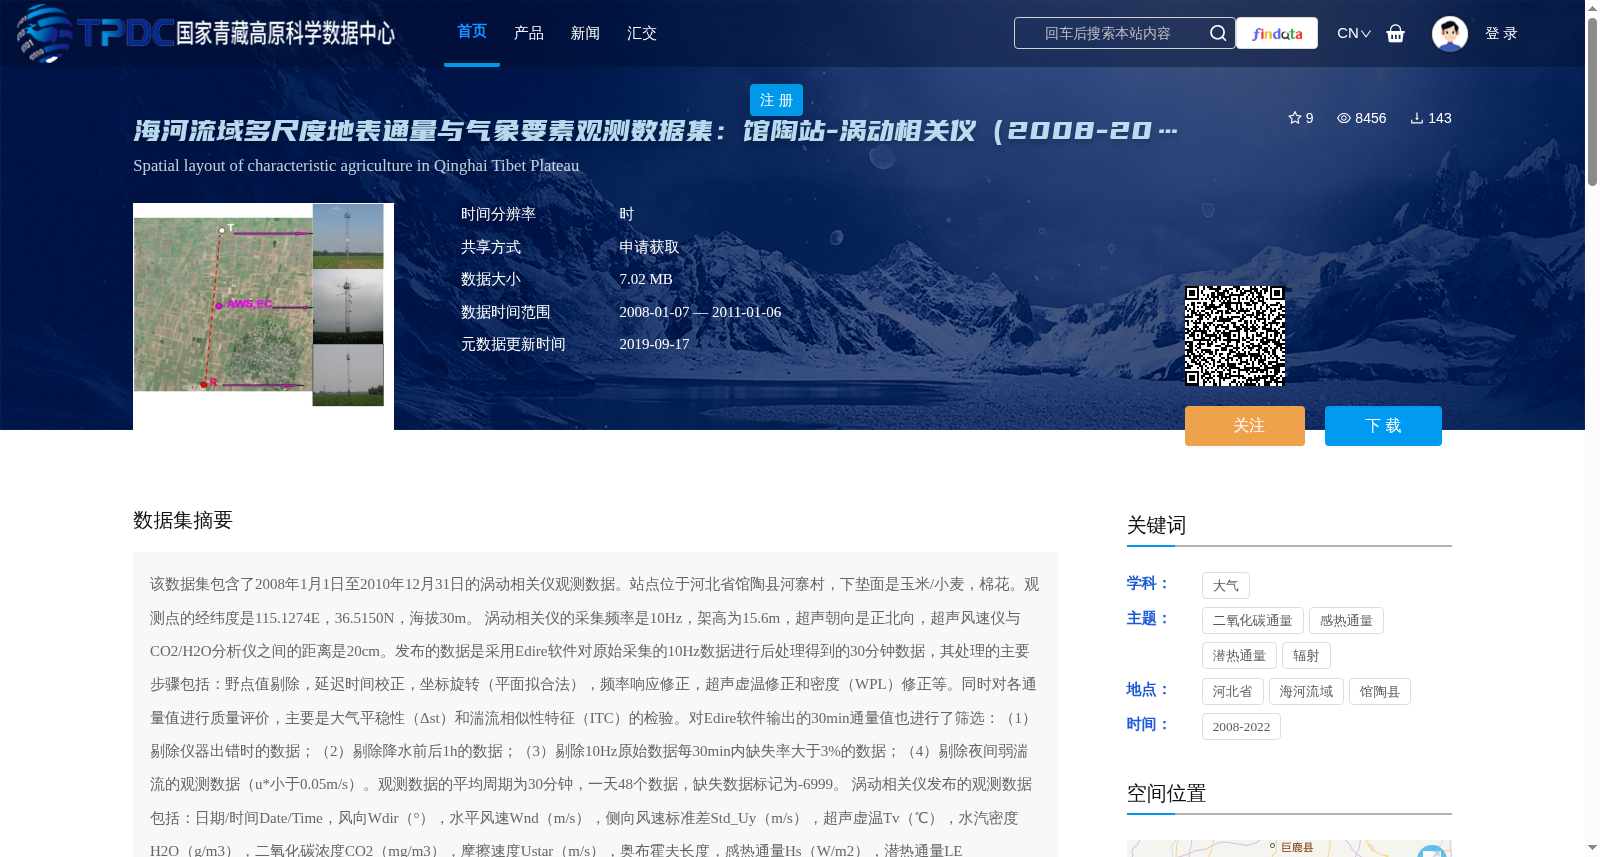
该数据集包含了2008年1月1日至2010年12月31日的涡动相关仪观测数据。站点位于河北省馆陶县河寨村,下垫面是玉米/小麦,棉花。观测点的经纬度是115.1274E,36.5150N,海拔30m。
涡动相关仪的采集频率是10Hz,架高为15.6m,超声朝向是正北向,超声风速仪与CO2/H2O分析仪之间的距离是20cm。发布的数据是采用Edire软件对原始采集的10Hz数据进行后处理得到的30分钟数据,其处理的主要步骤包括:野点值剔除,延迟时间校正,坐标旋转(平面拟合法),频率响应修正,超声虚温修正和密度(WPL)修正等。同时对各通量值进行质量评价,主要是大气平稳性(Δst)和湍流相似性特征(ITC)的检验。对Edire软件输出的30min通量值也进行了筛选:(1)剔除仪器出错时的数据;(2)剔除降水前后1h的数据;(3)剔除10Hz原始数据每30min内缺失率大于3%的数据;(4)剔除夜间弱湍流的观测数据(u*小于0.05m/s)。观测数据的平均周期为30分钟,一天48个数据,缺失数据标记为-6999。
涡动相关仪发布的观测数据包括:日期/时间Date/Time,风向Wdir(°),水平风速Wnd(m/s),侧向风速标准差Std_Uy(m/s),超声虚温Tv(℃),水汽密度H2O(g/m3),二氧化碳浓度CO2(mg/m3),摩擦速度Ustar(m/s),奥布霍夫长度,感热通量Hs(W/m2),潜热通量LE(W/m2),二氧化碳通量Fc(mg/(m2s)),感热通量的质量标识QA_Hs,潜热通量的质量标识QA_LE,二氧化碳通量的质量标识QA_Fc。感热、潜热、二氧化碳通量的质量标识分为九级(质量标识1:(0<Δst<15, 0< ITC<30); 2:(16<Δst<30, 0< ITC<30);3:( 0<Δst<30, 31< ITC<75); 4:(31<Δst<75, 0< ITC<30); 5:(0<Δst<75, 31< ITC<100); 6:(76<Δst<100, ITC<100); 7:(Δst<250, ITC<250); 8:(Δst<1000, ITC<1000); 其余为9)。数据时间的含义,如0:30代表0:00-0:30的平均;数据以*.xls格式存储。
观测试验或站点信息请参考 Jia et al,(2012),数据处理请参考Liu et al.(2013)。
This dataset contains eddy covariance observations from January 1, 2008 to December 31, 2010. The observation site is located at Hezhai Village, Guantao County, Hebei Province, with the underlying surface covered by croplands of maize/wheat and cotton. The coordinates of the observation point are 115.1274°E, 36.5150°N, and the elevation is 30 m.
The eddy covariance system has a sampling frequency of 10 Hz, an installation height of 15.6 m, the ultrasonic anemometer is oriented towards true north, and the distance between the ultrasonic anemometer and the CO2/H2O analyzer is 20 cm. The released 30-minute averaged data are derived from post-processing of the original 10 Hz raw data using the Edire software. The main processing steps include: outlier removal, time lag correction, coordinate rotation (planar fit method), frequency response correction, ultrasonic virtual temperature correction, and density (WPL) correction.
Meanwhile, quality assessment was conducted for each flux value, mainly including tests of atmospheric stability (Δst) and turbulence similarity characteristics (ITC). The 30-minute flux values output by Edire were also screened according to the following criteria: (1) removing data collected during instrument malfunctions; (2) removing data within 1 hour before and after precipitation events; (3) removing data where the missing rate of 10 Hz raw data within each 30-minute window exceeds 3%; (4) removing observational data with weak nighttime turbulence (u* < 0.05 m/s). The observational data are averaged over 30-minute periods, resulting in 48 data points per day, and missing values are marked as -6999.
The released observational data from the eddy covariance system include: Date/Time, wind direction Wdir (°), horizontal wind speed Wnd (m/s), lateral wind speed standard deviation Std_Uy (m/s), ultrasonic virtual temperature Tv (℃), water vapor density H2O (g/m³), carbon dioxide concentration CO2 (mg/m³), friction velocity Ustar (m/s), Obukhov length, sensible heat flux Hs (W/m²), latent heat flux LE (W/m²), carbon dioxide flux Fc (mg/(m²·s)), quality flag of sensible heat flux QA_Hs, quality flag of latent heat flux QA_LE, and quality flag of carbon dioxide flux QA_Fc.
The quality flags for sensible heat, latent heat, and carbon dioxide fluxes are divided into 9 levels: 1: (0 < Δst < 15, 0 < ITC < 30); 2: (16 < Δst < 30, 0 < ITC < 30); 3: (0 < Δst < 30, 31 < ITC < 75); 4: (31 < Δst < 75, 0 < ITC < 30); 5: (0 < Δst < 75, 31 < ITC < 100); 6: (76 < Δst < 100, ITC < 100); 7: (Δst < 250, ITC < 250); 8: (Δst < 1000, ITC < 1000); all others are level 9.
The meaning of the data timestamp: for example, 0:30 represents the average value from 0:00 to 0:30; all data are stored in *.xls format.
Please refer to Jia et al. (2012) for the observational experiment and site information, and Liu et al. (2013) for the data processing methods.
提供机构:
刘绍民,徐自为
创建时间:
2016-07-06
搜集汇总
数据集介绍
背景与挑战
背景概述
该数据集包含2008年至2010年海河流域馆陶站使用涡动相关仪观测的地表通量与气象要素数据,站点位于河北省馆陶县,下垫面为玉米/小麦和棉花,观测数据经过严格处理和质量控制,以30分钟为平均周期,包括感热通量、潜热通量和二氧化碳通量等关键变量,适用于水文、气象和环境研究。数据集提供了详细的元数据和质量标识,支持数据用户进行准确分析和引用。
以上内容由遇见数据集搜集并总结生成


