黑河流域地表过程综合观测网(大满超级站涡动相关仪-2024)
收藏资源简介:
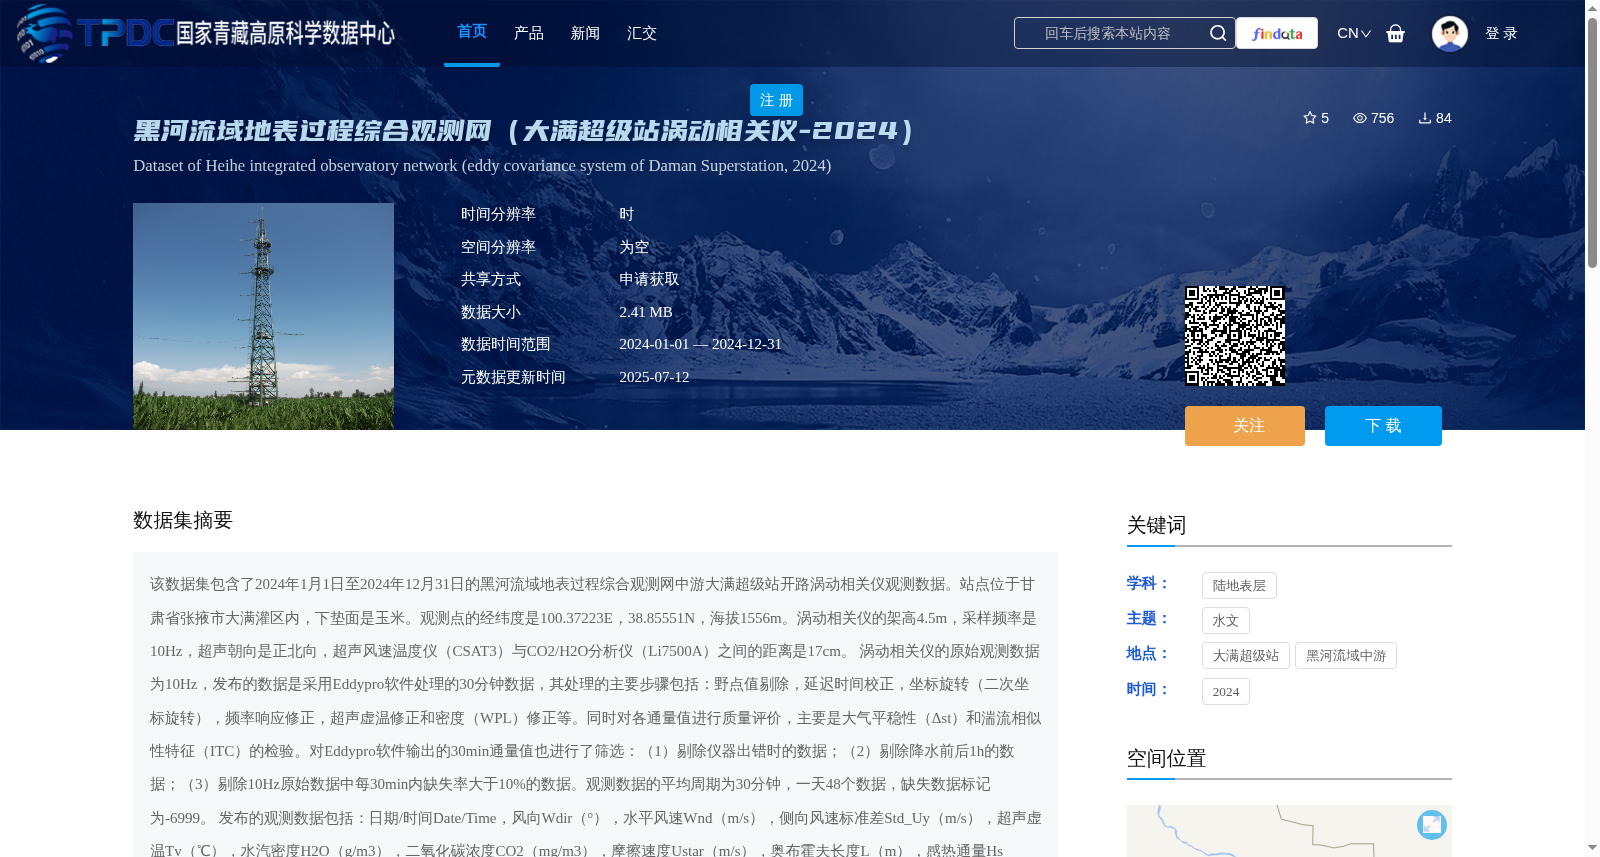
该数据集包含了2024年1月1日至2024年12月31日的黑河流域地表过程综合观测网中游大满超级站开路涡动相关仪观测数据。站点位于甘肃省张掖市大满灌区内,下垫面是玉米。观测点的经纬度是100.37223E,38.85551N,海拔1556m。涡动相关仪的架高4.5m,采样频率是10Hz,超声朝向是正北向,超声风速温度仪(CSAT3)与CO2/H2O分析仪(Li7500A)之间的距离是17cm。 涡动相关仪的原始观测数据为10Hz,发布的数据是采用Eddypro软件处理的30分钟数据,其处理的主要步骤包括:野点值剔除,延迟时间校正,坐标旋转(二次坐标旋转),频率响应修正,超声虚温修正和密度(WPL)修正等。同时对各通量值进行质量评价,主要是大气平稳性(Δst)和湍流相似性特征(ITC)的检验。对Eddypro软件输出的30min通量值也进行了筛选:(1)剔除仪器出错时的数据;(2)剔除降水前后1h的数据;(3)剔除10Hz原始数据中每30min内缺失率大于10%的数据。观测数据的平均周期为30分钟,一天48个数据,缺失数据标记为-6999。 发布的观测数据包括:日期/时间Date/Time,风向Wdir(°),水平风速Wnd(m/s),侧向风速标准差Std_Uy(m/s),超声虚温Tv(℃),水汽密度H2O(g/m3),二氧化碳浓度CO2(mg/m3),摩擦速度Ustar(m/s),奥布霍夫长度L(m),感热通量Hs(W/m2),潜热通量LE(W/m2),二氧化碳通量Fc(mg/(m2s)),感热通量的质量标识QA_Hs,潜热通量的质量标识QA_LE,二氧化碳通量的质量标识QA_Fc。感热、潜热、二氧化碳通量的质量标识分为九级(质量标识1-3数据质量好,4-6数据质量较好,7-8数据质量较差(较插补数据好);9数据质量差))。数据时间的含义,如0:30代表0:00-0:30的平均;数据以*.xls格式存储。 黑河流域地表过程综合观测网或站点信息请参考Liu et al. (2018)和Che et al. (2019)。
This dataset contains observations collected by the open-path eddy covariance system at the Daman Super Station in the middle reaches of the Heihe River Basin Comprehensive Observation Network for Land Surface Processes, spanning from January 1, 2024 to December 31, 2024. The station is located within the Daman Irrigation District, Zhangye City, Gansu Province, with maize as the underlying surface. The coordinates of the observation site are 100.37223°E, 38.85551°N, and the elevation is 1556 m. The eddy covariance system is mounted at a height of 4.5 m, with a sampling frequency of 10 Hz. The ultrasonic sensor faces due north, and the distance between the CSAT3 ultrasonic anemometer/thermometer and the Li7500A CO2/H2O analyzer is 17 cm. The raw observations from the eddy covariance system are at 10 Hz, while the released data are 30-minute averages processed using the EddyPro software. The main processing steps include: outlier removal, time lag correction, double coordinate rotation, frequency response correction, ultrasonic virtual temperature correction, and Webb-Pearman-Leuning (WPL) density correction, among others. Quality assessments were also conducted for all flux values, primarily through tests of atmospheric stationarity (Δst) and turbulence similarity characteristics (ITC). The 30-minute flux values output by EddyPro were also screened: (1) removing data collected during instrument malfunctions; (2) removing data within 1 hour before and after precipitation events; (3) removing data with a missing rate exceeding 10% within each 30-minute window of the 10 Hz raw observations. The observation data have an average period of 30 minutes, resulting in 48 data points per day, and missing values are marked as -6999. The released observation data include: Date/Time, Wind Direction (Wdir, °), Horizontal Wind Speed (Wnd, m/s), Lateral Wind Speed Standard Deviation (Std_Uy, m/s), Ultrasonic Virtual Temperature (Tv, ℃), Water Vapor Density (H2O, g/m³), Carbon Dioxide Concentration (CO2, mg/m³), Friction Velocity (Ustar, m/s), Obukhov Length (L, m), Sensible Heat Flux (Hs, W/m²), Latent Heat Flux (LE, W/m²), Carbon Dioxide Flux (Fc, mg/(m²·s)), Quality Flag for Sensible Heat Flux (QA_Hs), Quality Flag for Latent Heat Flux (QA_LE), and Quality Flag for Carbon Dioxide Flux (QA_Fc). The quality flags for sensible heat, latent heat, and carbon dioxide fluxes have nine levels: Quality flags 1–3 indicate good data quality, 4–6 indicate fair data quality, 7–8 indicate poor data quality (better than interpolated data), and 9 indicates very poor data quality. The meaning of the data timestamp is as follows: for example, 0:30 represents the average value from 0:00 to 0:30; all data are stored in *.xls format. For information on the Heihe River Basin Comprehensive Observation Network for Land Surface Processes or individual stations, please refer to Liu et al. (2018) and Che et al. (2019).