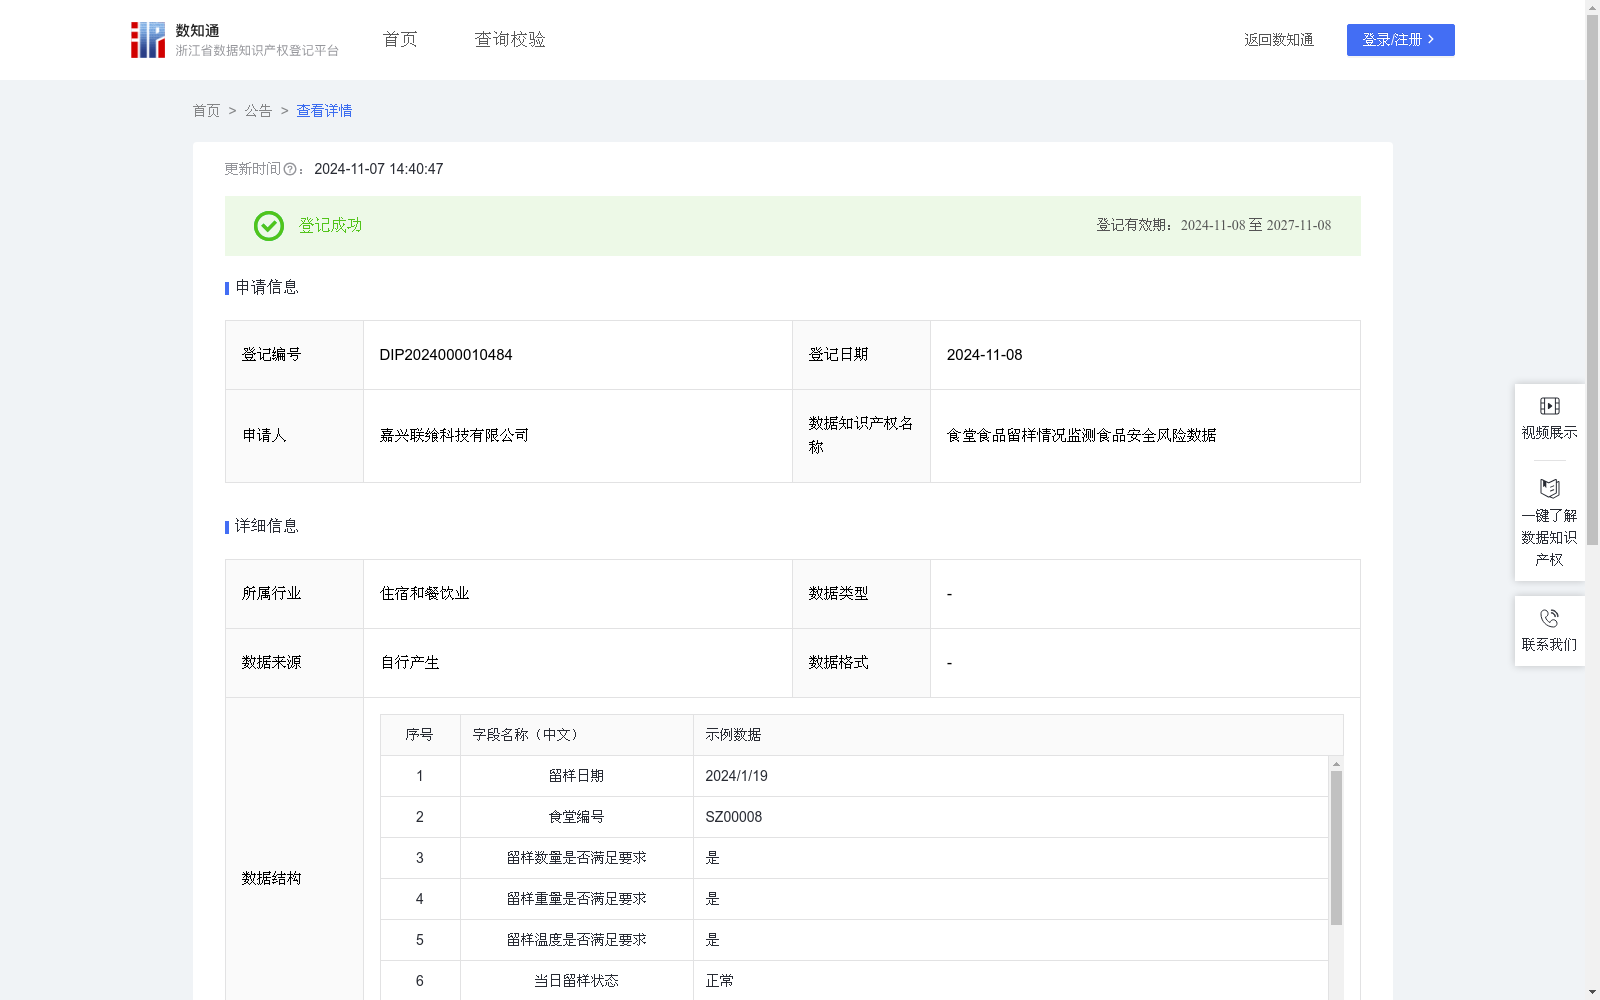
食堂食品留样情况监测食品安全风险数据
收藏浙江省数据知识产权登记平台2024-11-07 更新2024-11-08 收录
下载链接:
https://www.zjip.org.cn/home/announce/trends/82120
下载链接
链接失效反馈官方服务:
资源简介:
基于食物留样情况统计的食堂食品安全风险指数是一个创新的量化工具,可用于评估食物留样异常操作可能对食品安全造成的风险程度。 1.食堂可以通过本数据了解当前食堂食品安全的整体风险状况,及时发现潜在的食品安全问题,指数的变化也可以实时反映食堂食品安全追溯工作的质量和稳定性,结合对异常天数和异常原因的分析,食堂可以及时做出针对性的措施。2.餐饮监管部门可以利用本数据作为监管食堂食品安全的依据之一,可通过指数的变化及时发现食品安全风险较高的食堂,提前进行干预和指导。3.食堂或和监管机构可以将本数据对外披露公开,体现本单位或本地区对食品追溯工作的重视和承诺,有利于增强用餐者的信任。4.保险公司可根据本数据提前识别目标食堂客户的投保风险,从而确定相关保险产品的定价,如食品安全责任险。5.本数据还能为食物留样机厂家对设备进行功能改进或提升提供依据。1.数据抽取和预处理: (1)数据抽取:在自研的5G智慧食安工业物联网数字化管理平台数据库中抽取相关食堂的食物留样数据,包括日期、食堂编号、所在地区、留样数量是否满足要求、留样重量是否满足要求、留样温度是否满足要求。(2)数据预处理:对抽取的数据进行清洗,去除重复、错误或无关的信息,以便后续的分析和建模。 2.基于食物留样情况统计数据预测食堂食品安全风险数据: (1)当日留样状态判定:若留样数量、留样重量、留样温度出现一次“否”,则判定为“异常”,反之则判定为“正常”;(2)计算近30天留样异常总天数和三种原因分别的异常天数:利用CountIf函数分别对近30日留样状态为异常的天数和近30日留样数量、重量和温度状态为异常的天数进行累加;(3)建立食堂食品安全风险评估模型:基于食物留样情况统计的食堂食品安全风险指数=近30日留样异常总天数×a+近30日留样数量异常天数×b+近30日留样重量异常天数×c+近30日留样温度异常天数×d;a~d为对应的系数,根据不同原因对食品安全追溯工作的影响程度确定,属于我司商业秘密,故不作详细列举。
The Canteen Food Safety Risk Index based on food sample retention statistics is an innovative quantitative tool for evaluating the degree of risk that abnormal food sample retention operations may pose to food safety.
1. Canteens can use this dataset to understand the overall food safety risk status of their current canteen, identify potential food safety issues in a timely manner. The changes in the index can also reflect the quality and stability of the canteen's food safety traceability work in real time. Combined with the analysis of abnormal days and their causes, canteens can promptly implement targeted measures.
2. Food safety regulatory authorities can use this dataset as one of the bases for supervising canteen food safety. They can identify canteens with relatively high food safety risks in a timely manner through changes in the index, and carry out early intervention and guidance.
3. Canteens or regulatory agencies can publicly disclose this dataset, demonstrating the attention and commitment of their unit or region to food traceability work, which is conducive to enhancing the trust of diners.
4. Insurance companies can use this dataset to identify the underwriting risks of target canteen customers in advance, so as to determine the pricing of relevant insurance products, such as food safety liability insurance.
5. This dataset can also provide a basis for food sample retention equipment manufacturers to improve or upgrade the functions of their equipment.
1. Data Extraction and Preprocessing:
(1) Data Extraction: Extract food sample retention data of relevant canteens from the database of the self-developed 5G Smart Food Safety Industrial Internet of Things (IIoT) digital management platform, including date, canteen number, location, whether the sample retention quantity meets the requirements, whether the sample retention weight meets the requirements, and whether the sample retention temperature meets the requirements.
(2) Data Preprocessing: Clean the extracted data to remove duplicate, erroneous or irrelevant information for subsequent analysis and modeling.
2. Prediction of canteen food safety risk data based on food sample retention statistics:
(1) Daily sample retention status judgment: If any one of the sample retention quantity, weight and temperature is marked "No", it is judged as "Abnormal"; otherwise, it is judged as "Normal".
(2) Calculate the total number of abnormal days in the past 30 days and the number of abnormal days for each of the three causes: Use the CountIf function to accumulate the number of days with abnormal sample retention status in the past 30 days, and the number of days with abnormal sample retention quantity, weight and temperature respectively in the past 30 days.
(3) Establish a canteen food safety risk assessment model: The canteen food safety risk index based on food sample retention statistics = Total number of abnormal sample retention days in the past 30 days × a + Number of abnormal sample retention quantity days in the past 30 days × b + Number of abnormal sample retention weight days in the past 30 days × c + Number of abnormal sample retention temperature days in the past 30 days × d; a~d are corresponding coefficients, which are determined according to the impact degree of different causes on food safety traceability work, and belong to the trade secrets of our company, so they will not be listed in detail.
提供机构:
嘉兴联飨科技有限公司
创建时间:
2024-09-30
搜集汇总
数据集介绍
特点
该数据集提供了食堂食品留样的详细监测数据,用于评估食品安全风险,数据每日更新,适用于食堂自我监控、餐饮监管和保险定价等多个场景。
以上内容由遇见数据集搜集并总结生成


