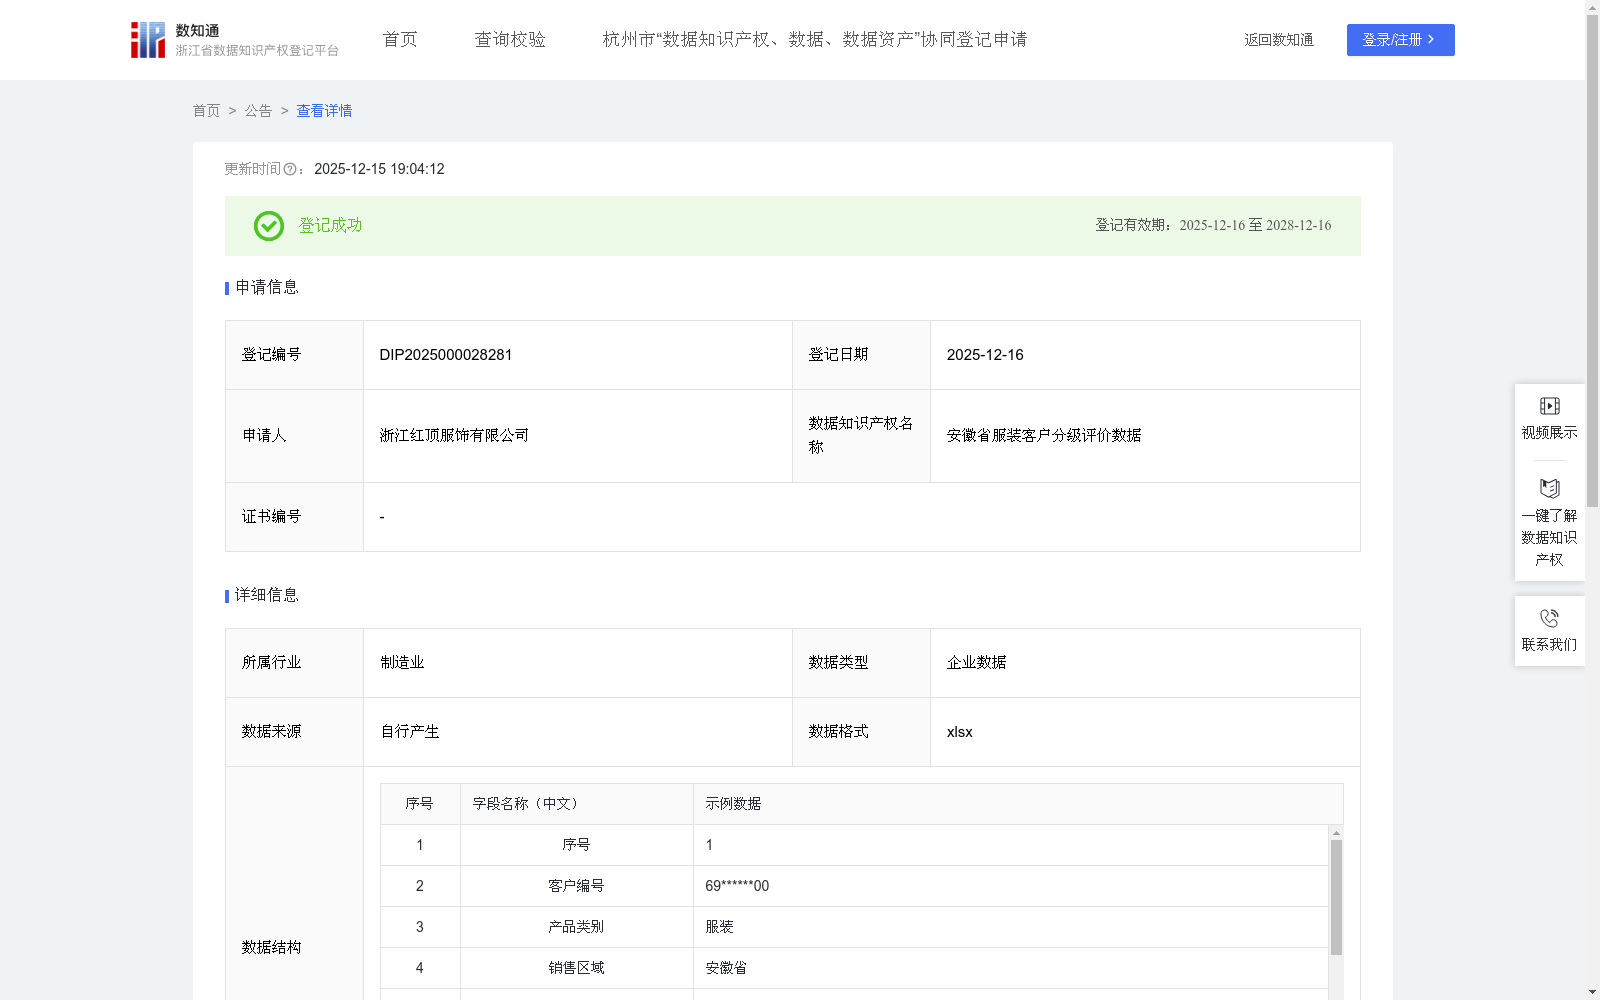
安徽省服装客户分级评价数据
收藏资源简介:
采集销售记录表中购买服装的数据,通过客户在2025年7月1日距离2025年9月30日间隔的距离最近一次消费时间天数R天、客户在2025年7月1日至2025年9月30日之间消费件数F件和客户在2025年7月1日至2025年9月30日之间消费金额M元, 采用 RFM 模型对客户进行价值评级,实现精准化运营,通过对购买服装客户价值管理,满足不同价值客户的个性化需求。对A级客户,每个月进行一次回访维护,对B级客户,每个季度进行一次回访维护,对C级客户每半年进行一次回访维护,对D级客户每年进行一次回访维护。另外可以为本客户群体高度重叠企业提供不同价值类型的客户个性化服务的数据支持。对从销售记录表中采集到的数据进行脱敏、降噪、清洗、聚集、分析。2、数据加工:运用RFM模型结合客户在2025年7月1日距离2025年9月30日间隔的距离最近一次消费时间天数R天、客户在2025年7月1日至2025年9月30日之间消费件数F件和客户在2025年7月1日至2025年9月30日之间消费金额M元的得分排名对客户进行一个综合排名,最终得出一个RFM总评分。a.提取出最近一次消费时间距离当前分析时间的天数R、客户在2025年7月1日距离2025年9月30日之间消费件数F件和客户在2025年7月1日距离2025年9月30日之间消费金额M元进行分类,最近一次消费时间间隔最短的客户排在最上面。按照从1-5评分,前20%的客户获得5分,接下来的20%用户获得4分,再下来20%的客户为3分,再下来20% 的客户为2分,最后20% 的客户为1分。 b.根据客户在2025年7月1日距离2025年9月30日消费件数F件从高到底依次对用户进行分类,前20%的客户在用户活动频率的分数为5,以此类推。 C, 根据客户在2025年7月1日距离2025年9月30日消费金额M元,前20%的客户在消费金额的分数为5,以此类推。消费金额最少的20%客户则分数为1。 RFM得分=0.3*(R得分)+0.3*(F得分)+0.4*(M得分) 评分大于等于4分的为A级客户,大于等于3小于4的为B级客户,大于等于2小于3的为C 级客户,低于2的为D级客户。
Data pertaining to apparel purchases is extracted from sales record databases. Three core metrics are derived: R, the number of days R from the customer's most recent purchase to the cutoff date September 30, 2025 within the analysis period from July 1, 2025 to September 30, 2025; F, the total number of purchased items by the customer during this period; and M, the total consumption amount incurred by the customer during this period. The RFM model is employed to perform customer value segmentation and rating, enable precise operational management, and address the personalized demands of customers across different value tiers via targeted value management of apparel-purchasing customers. For Class A customers, monthly follow-up visits and maintenance services are provided; for Class B customers, quarterly follow-up visits; for Class C customers, semi-annual follow-up visits; and for Class D customers, annual follow-up visits. Furthermore, this dataset can offer data support for enterprises with highly overlapping customer groups to deliver personalized services tailored to customers of distinct value types. The collected sales data undergoes a series of preprocessing steps including data desensitization, noise reduction, cleaning, aggregation, and exploratory analysis. 2. Data Processing: The RFM model is utilized to conduct a comprehensive ranking of customers based on the score rankings of the three metrics R, F, and M, thereby generating an overall RFM score. a. Extract and categorize the three metrics: R (recency in days), F (purchase frequency), and M (monetary value). Customers with the shortest recency interval are ranked highest. Customers are scored on a 1-5 scale: the top 20% of customers receive a score of 5, the subsequent 20% receive 4, the next 20% receive 3, the following 20% receive 2, and the bottom 20% receive 1. b. Rank customers in descending order based on their F value (number of purchased items during the analysis period from July 1 to September 30, 2025). The top 20% of customers are assigned a score of 5 for their purchase frequency, and the scoring follows the same 20% tiered rule for the remaining groups. c. Rank customers in descending order based on their M value (total consumption amount during the analysis period from July 1 to September 30, 2025). The top 20% of customers are assigned a score of 5 for their consumption amount, and the bottom 20% of customers with the lowest consumption amount receive a score of 1, following the same tiered scoring rule. The overall RFM score is calculated using the weighted formula: RFM Score = 0.3 × R Score + 0.3 × F Score + 0.4 × M Score Customers are categorized into four tiers based on their overall RFM score: Class A (score ≥ 4), Class B (3 ≤ score < 4), Class C (2 ≤ score < 3), and Class D (score < 2).