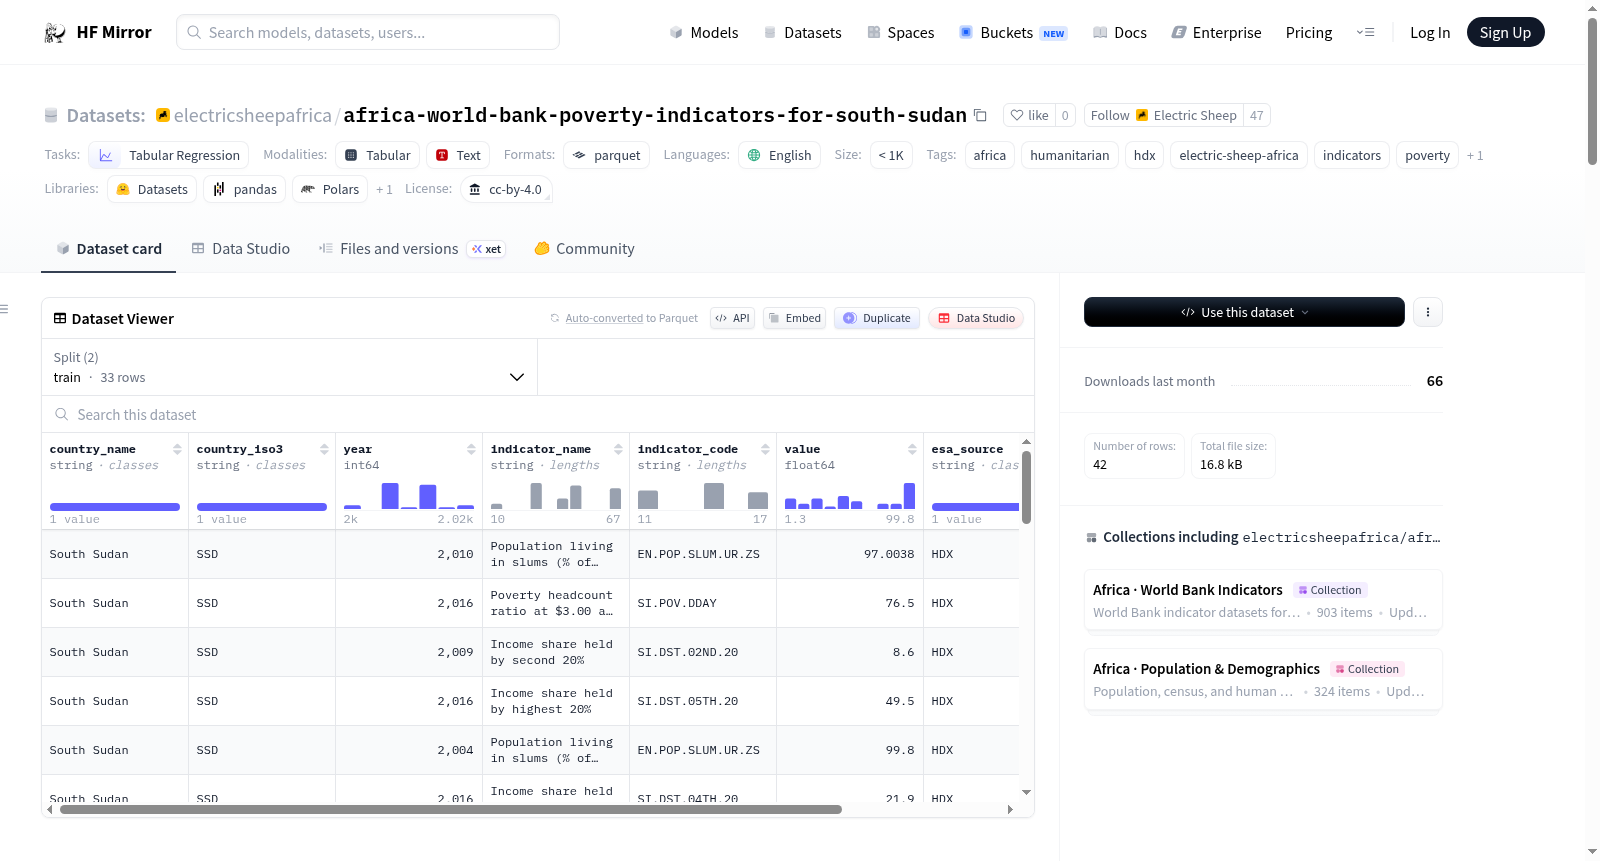
electricsheepafrica/africa-world-bank-poverty-indicators-for-south-sudan
收藏Hugging Face2026-04-10 更新2026-04-12 收录
下载链接:
https://hf-mirror.com/datasets/electricsheepafrica/africa-world-bank-poverty-indicators-for-south-sudan
下载链接
链接失效反馈官方服务:
资源简介:
---
annotations_creators:
- no-annotation
language_creators:
- found
language:
- en
license: cc-by-4.0
multilinguality:
- monolingual
size_categories:
- n<1K
source_datasets:
- original
task_categories:
- tabular-regression
task_ids: []
tags:
- africa
- humanitarian
- hdx
- electric-sheep-africa
- indicators
- poverty
- ssd
pretty_name: "South Sudan - Poverty"
dataset_info:
splits:
- name: train
num_examples: 33
- name: test
num_examples: 8
---
# South Sudan - Poverty
**Publisher:** World Bank Group · **Source:** [HDX](https://data.humdata.org/dataset/world-bank-poverty-indicators-for-south-sudan) · **License:** `cc-by` · **Updated:** 2026-03-27
---
## Abstract
Contains data from the World Bank's [data portal](http://data.worldbank.org/). There is also a [consolidated country dataset](https://data.humdata.org/dataset/world-bank-combined-indicators-for-south-sudan) on HDX.
For countries with an active poverty monitoring program, the World Bank—in collaboration with national institutions, other development agencies, and civil society—regularly conducts analytical work to assess the extent and causes of poverty and inequality, examine the impact of growth and public policy, and review household survey data and measurement methods. Data here includes poverty and inequality measures generated from analytical reports, from national poverty monitoring programs, and from the World Bank’s Development Research Group which has been producing internationally comparable and global poverty estimates and lines since 1990.
Each row in this dataset represents country-level aggregates. Data was last updated on HDX on 2026-03-27. Geographic scope: **SSD**.
*Curated into ML-ready Parquet format by [Electric Sheep Africa](https://huggingface.co/electricsheepafrica).*
---
## Dataset Characteristics
| | |
|---|---|
| **Domain** | Poverty and economic vulnerability |
| **Unit of observation** | Country-level aggregates |
| **Rows (total)** | 42 |
| **Columns** | 8 (2 numeric, 6 categorical, 0 datetime) |
| **Train split** | 33 rows |
| **Test split** | 8 rows |
| **Geographic scope** | SSD |
| **Publisher** | World Bank Group |
| **HDX last updated** | 2026-03-27 |
---
## Variables
**Geographic** — `country_name` (South Sudan), `country_iso3` (SSD), `year` (range 2002.0–2022.0).
**Outcome / Measurement** — `value` (range 1.3–99.8058).
**Identifier / Metadata** — `indicator_name` (Population living in slums (% of urban population), Income share held by second 20%, Poverty headcount ratio at $8.30 a day (2021 PPP) (% of population)), `indicator_code` (EN.POP.SLUM.UR.ZS, SI.DST.02ND.20, SI.POV.UMIC), `esa_source` (HDX), `esa_processed` (2026-04-10).
---
## Quick Start
```python
from datasets import load_dataset
ds = load_dataset("electricsheepafrica/africa-world-bank-poverty-indicators-for-south-sudan")
train = ds["train"].to_pandas()
test = ds["test"].to_pandas()
print(train.shape)
train.head()
```
---
## Schema
| Column | Type | Null % | Range / Sample Values |
|---|---|---|---|
| `country_name` | object | 0.0% | South Sudan |
| `country_iso3` | object | 0.0% | SSD |
| `year` | int64 | 0.0% | 2002.0 – 2022.0 (mean 2012.4524) |
| `indicator_name` | object | 0.0% | Population living in slums (% of urban population), Income share held by second 20%, Poverty headcount ratio at $8.30 a day (2021 PPP) (% of population) |
| `indicator_code` | object | 0.0% | EN.POP.SLUM.UR.ZS, SI.DST.02ND.20, SI.POV.UMIC |
| `value` | float64 | 0.0% | 1.3 – 99.8058 (mean 53.9217) |
| `esa_source` | object | 0.0% | HDX |
| `esa_processed` | object | 0.0% | 2026-04-10 |
---
## Numeric Summary
| Column | Min | Max | Mean | Median |
|---|---|---|---|---|
| `year` | 2002.0 | 2022.0 | 2012.4524 | 2013.0 |
| `value` | 1.3 | 99.8058 | 53.9217 | 50.0 |
---
## Curation
Raw data was downloaded from HDX via the CKAN API and converted to Parquet. Column names were lowercased and standardised to snake_case. Common missing-value markers (`N/A`, `null`, `none`, `-`, `unknown`, `no data`, `#N/A`) were unified to `NaN`. The dataset was split 80/20 into train and test partitions using a fixed random seed (42) and saved as Snappy-compressed Parquet.
---
## Limitations
- Data originates from World Bank Group and has not been independently validated by ESA.
- Automated cleaning cannot correct for misreported values, definitional inconsistencies, or sampling bias in the original collection.
- Refer to the [original HDX dataset page](https://data.humdata.org/dataset/world-bank-poverty-indicators-for-south-sudan) for the publisher's own methodology notes and caveats.
---
## Citation
```bibtex
@dataset{hdx_africa_world_bank_poverty_indicators_for_south_sudan,
title = {South Sudan - Poverty},
author = {World Bank Group},
year = {2026},
url = {https://data.humdata.org/dataset/world-bank-poverty-indicators-for-south-sudan},
note = {Repackaged for machine learning by Electric Sheep Africa (https://huggingface.co/electricsheepafrica)}
}
```
---
*[Electric Sheep Africa](https://huggingface.co/electricsheepafrica) — Africa's ML dataset infrastructure. Lagos, Nigeria.*
提供机构:
electricsheepafrica
搜集汇总
数据集介绍
构建方式
在贫困监测与经济发展研究领域,该数据集源自世界银行集团,通过其数据门户系统性地收集了南苏丹的国家级贫困与不平等指标。原始数据经由人道主义数据交换平台获取,并由Electric Sheep Africa团队进行技术性处理,包括通过CKAN API下载、转换为Parquet格式、统一缺失值标记,并采用固定随机种子将数据划分为训练集与测试集,最终形成包含42条记录的结构化表格。
特点
本数据集聚焦于南苏丹的贫困与经济脆弱性评估,其核心特征体现在高度结构化的国家层面聚合数据。数据集涵盖2002年至2022年间的时间序列,包含人口居住于贫民窟比例、收入份额分布以及基于购买力平价的贫困率等多维指标,并以清晰的分类与数值变量呈现。数据经过标准化清洗,确保了格式一致性,且专为机器学习任务设计,具备明确的训练与测试划分,为区域经济分析提供了精炼而可靠的实证基础。
使用方法
针对发展经济学与政策评估的应用场景,研究者可通过Hugging Face的datasets库直接加载该数据集,并利用Python环境进行便捷的数据访问与转换。数据集已预分割为训练与测试子集,支持快速转换为Pandas DataFrame以进行探索性分析或模型训练。用户可依据指示器代码与年份变量开展时间趋势分析、贫困指标预测或跨维度关联研究,同时建议参考原始世界银行方法论说明以深入理解数据背景与局限性。
背景与挑战
背景概述
世界银行集团自1990年起,便与发展研究小组及各国机构合作,系统性地开展全球贫困监测与分析工作,旨在评估贫困与不平等的程度、成因及其与公共政策的关联。'africa-world-bank-poverty-indicators-for-south-sudan'数据集正是在此背景下应运而生,由世界银行集团发布,并由Electric Sheep Africa于2026年重新整理为机器学习可用格式。该数据集聚焦南苏丹这一战后重建国家,汇集了2002年至2022年间的国家级贫困与不平等指标,如贫民窟人口比例、收入份额及贫困人口比率等,为理解该国社会经济脆弱性提供了关键数据支撑,对发展经济学、人道主义干预及政策评估领域具有重要参考价值。
当前挑战
该数据集致力于解决南苏丹贫困与不平等状况的量化评估问题,其核心挑战在于如何从有限且可能不完整的原始调查数据中,提取出可靠、可比的跨国贫困指标。构建过程中面临的挑战尤为显著:数据规模极为有限,总样本仅42行,涵盖时间跨度虽长但数据点稀疏,这限制了复杂模型的训练与泛化能力;指标定义与收集方法可能随年份与国家政策变动,导致时间序列上的不一致性;此外,原始数据可能存在报告偏差、缺失值或测量误差,而自动化清洗流程难以修正这些深层的质量问题,需依赖发布方的方法论说明进行谨慎解读。
常用场景
经典使用场景
在贫困与经济发展研究领域,该数据集作为南苏丹国家层面的贫困指标聚合数据,常被用于构建回归模型以预测贫困趋势。学者们利用其包含的年份、指标代码和数值变量,分析如贫民窟人口比例、收入分配及贫困率等关键指标随时间的变化规律,从而揭示社会经济动态。
解决学术问题
该数据集解决了国际发展研究中关于贫困测量与比较的若干核心问题,例如如何量化低收入国家的贫困程度、评估不平等状况以及追踪公共政策干预的效果。通过提供标准化的指标数据,它支持了跨时期、跨区域的实证分析,为理解贫困成因和制定减贫策略提供了可靠的数据基础。
衍生相关工作
围绕该数据集衍生的经典工作包括基于机器学习的贫困预测研究,如利用回归算法模拟贫困指标的未来走势;同时,它也促进了比较发展经济学的实证分析,例如结合其他非洲国家数据探讨区域贫困差异,或评估世界银行减贫项目的长期影响,推动了数据驱动的发展政策研究。
以上内容由遇见数据集搜集并总结生成


