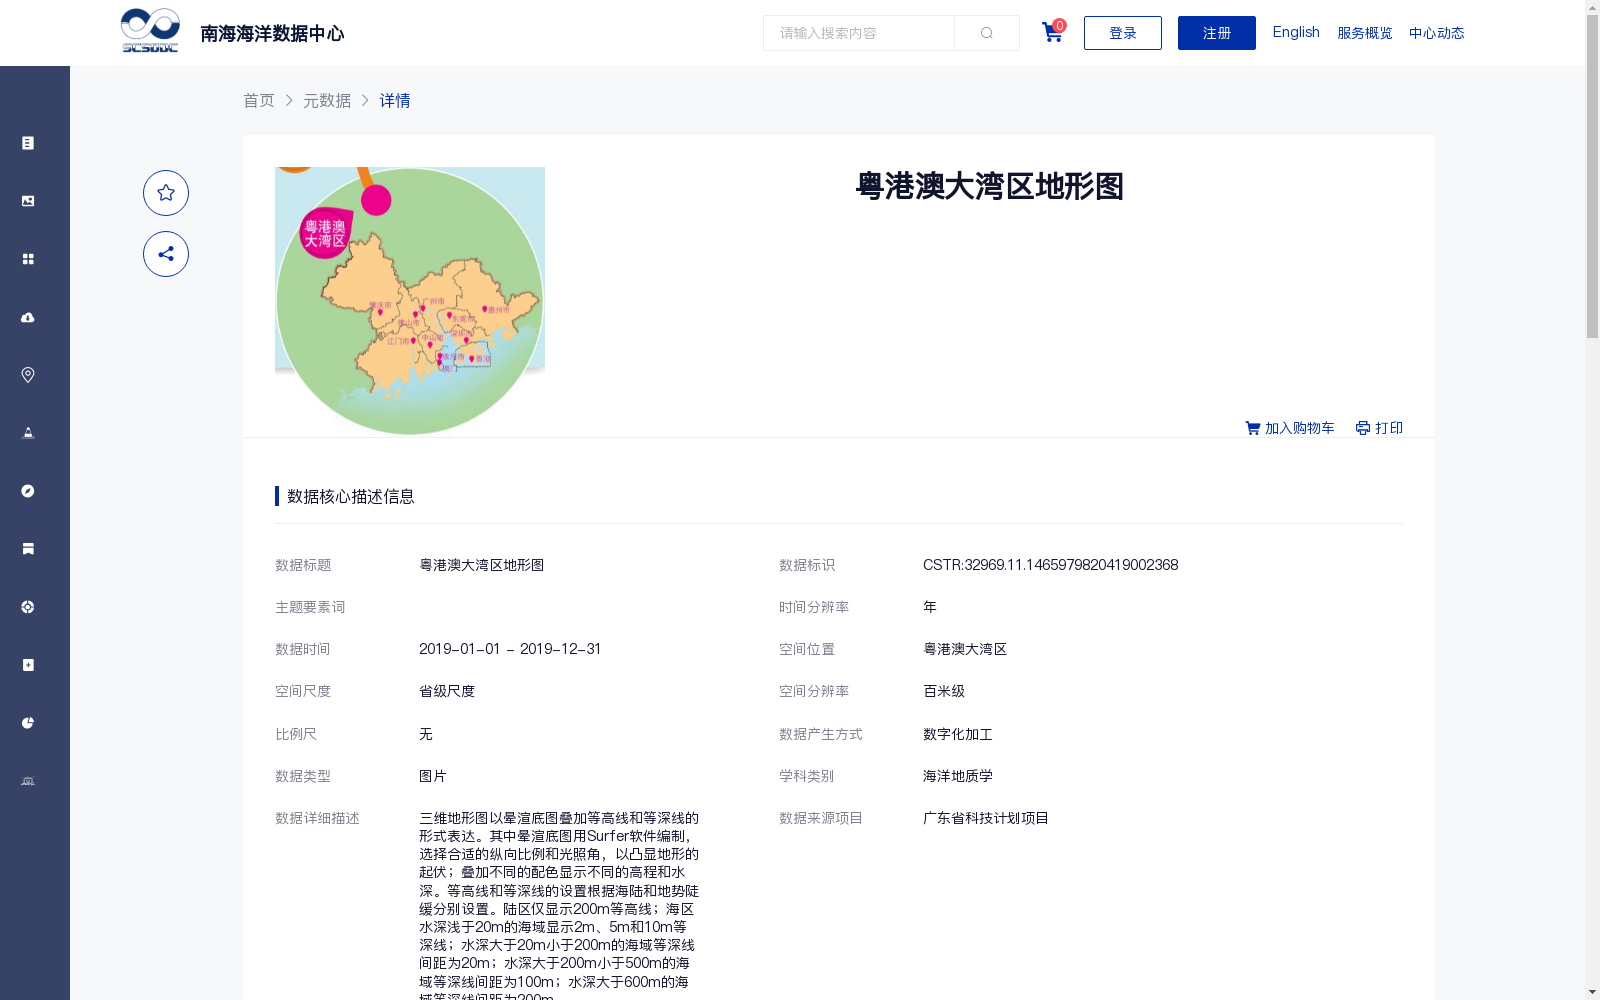
粤港澳大湾区地形图
收藏南海海洋数据中心2024-03-01 收录
下载链接:
https://data.scsio.ac.cn/metaData-detail/1465979820419002368
下载链接
链接失效反馈官方服务:
资源简介:
三维地形图以晕渲底图叠加等高线和等深线的形式表达。其中晕渲底图用Surfer软件编制,选择合适的纵向比例和光照角,以凸显地形的起伏;叠加不同的配色显示不同的高程和水深。等高线和等深线的设置根据海陆和地势陡缓分别设置。陆区仅显示200m等高线;海区水深浅于20m的海域显示2m、5m和10m等深线;水深大于20m小于200m的海域等深线间距为20m;水深大于200m小于500m的海域等深线间距为100m;水深大于600m的海域等深线间距为200m。
3D topographic maps are rendered by overlaying contour lines and bathymetric lines onto a shaded relief base map. The shaded relief base map is compiled using Surfer software, with appropriate vertical scaling and illumination angles selected to accentuate topographic relief; different color schemes are overlaid to represent varying elevations and water depths. The settings of contour lines and bathymetric lines are adjusted separately based on land-sea distribution and terrain steepness. Only the 200m contour line is displayed on land areas; for sea areas with water depth shallower than 20m, the 2m, 5m, and 10m bathymetric lines are shown; for sea areas with water depth ranging from 20m to 200m, the interval between adjacent bathymetric lines is 20m; for sea areas with water depth ranging from 200m to 500m, the interval between adjacent bathymetric lines is 100m; for sea areas with water depth greater than 600m, the interval between adjacent bathymetric lines is 200m.
提供机构:
广州海洋地质调查局
搜集汇总
数据集介绍
背景与挑战
背景概述
该数据集是2019年粤港澳大湾区的三维地形图,以图片形式呈现,空间分辨率为百米级,适用于省级尺度分析。它通过晕渲底图叠加等高线和等深线,详细表达地形起伏和水深变化,主要用于海洋地质学研究,数据完全开放共享。
以上内容由遇见数据集搜集并总结生成


