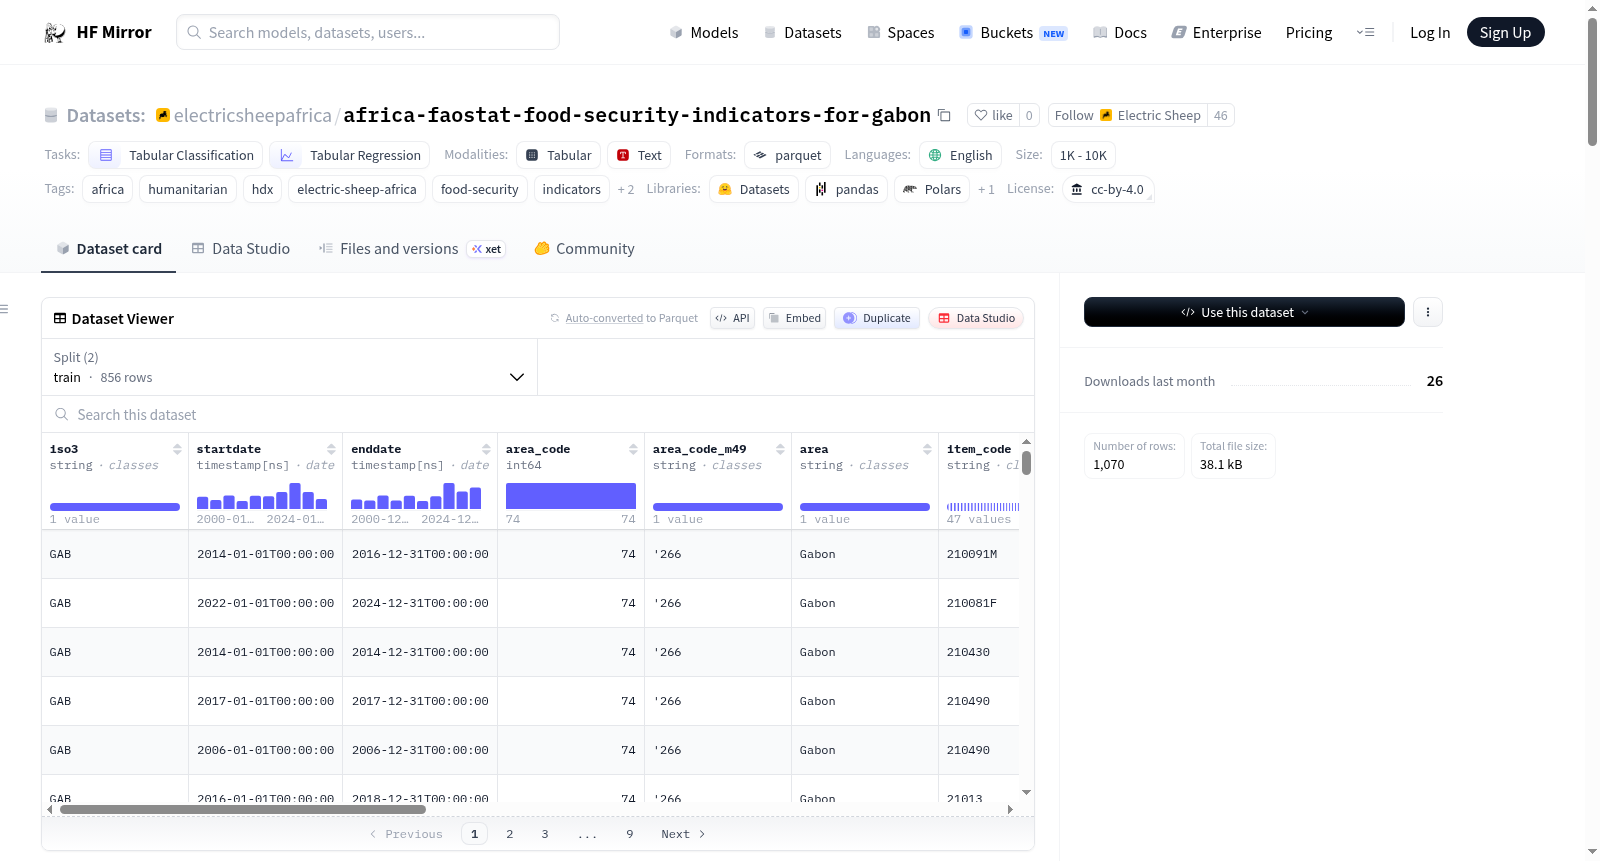
electricsheepafrica/africa-faostat-food-security-indicators-for-gabon
收藏Hugging Face2026-04-11 更新2026-04-12 收录
下载链接:
https://hf-mirror.com/datasets/electricsheepafrica/africa-faostat-food-security-indicators-for-gabon
下载链接
链接失效反馈官方服务:
资源简介:
---
annotations_creators:
- no-annotation
language_creators:
- found
language:
- en
license: cc-by-4.0
multilinguality:
- monolingual
size_categories:
- 1K<n<10K
source_datasets:
- original
task_categories:
- tabular-classification
- tabular-regression
task_ids: []
tags:
- africa
- humanitarian
- hdx
- electric-sheep-africa
- food-security
- indicators
- nutrition
- gab
pretty_name: "Gabon - Food Security and Nutrition Indicators"
dataset_info:
splits:
- name: train
num_examples: 856
- name: test
num_examples: 214
---
# Gabon - Food Security and Nutrition Indicators
**Publisher:** Food and Agriculture Organization (FAO) of the United Nations · **Source:** [HDX](https://data.humdata.org/dataset/faostat-food-security-indicators-for-gabon) · **License:** `cc-by-igo` · **Updated:** 2026-04-06
---
## Abstract
Food Security and Nutrition Indicators for Gabon.
Contains data from the FAOSTAT [bulk data service](https://fenixservices.fao.org/faostat/static/bulkdownloads/datasets_E.json).
Each row in this dataset represents country-level aggregates. Temporal coverage is indicated by the `startdate`, `enddate` column(s). Geographic scope: **GAB**.
*Curated into ML-ready Parquet format by [Electric Sheep Africa](https://huggingface.co/electricsheepafrica).*
---
## Dataset Characteristics
| | |
|---|---|
| **Domain** | Food security and nutrition |
| **Unit of observation** | Country-level aggregates |
| **Rows (total)** | 1,070 |
| **Columns** | 17 (5 numeric, 10 categorical, 2 datetime) |
| **Train split** | 856 rows |
| **Test split** | 214 rows |
| **Geographic scope** | GAB |
| **Publisher** | Food and Agriculture Organization (FAO) of the United Nations |
| **HDX last updated** | 2026-04-06 |
---
## Variables
**Geographic** — `iso3` (GAB), `year_code` (range 2000.0–20222024.0), `year` (range 2000.0–2024.0).
**Temporal** — `startdate`, `enddate`.
**Outcome / Measurement** — `value` (range -0.26–21717.0).
**Identifier / Metadata** — `area_code` (range 74.0–74.0), `area_code_m49` ('266), `item_code` (210071, 210091F, 210081F), `element_code` (range 6121.0–61322.0), `esa_source` (HDX) and 1 others.
**Other** — `area` (Gabon), `item` (Number of severely food insecure people (million) (3-year average), Prevalence of moderate or severe food insecurity in the female adult population (percent) (3-year average), Number of moderately or severely food insecure female adults (million) (3-year average)), `element` (Value, Confidence interval: Lower bound, Confidence interval: Upper bound), `unit` (%, million No, kcal/cap/d), `flag` (E, X, Q).
---
## Quick Start
```python
from datasets import load_dataset
ds = load_dataset("electricsheepafrica/africa-faostat-food-security-indicators-for-gabon")
train = ds["train"].to_pandas()
test = ds["test"].to_pandas()
print(train.shape)
train.head()
```
---
## Schema
| Column | Type | Null % | Range / Sample Values |
|---|---|---|---|
| `iso3` | object | 0.0% | GAB |
| `startdate` | datetime64[ns] | 0.0% | |
| `enddate` | datetime64[ns] | 0.0% | |
| `area_code` | int64 | 0.0% | 74.0 – 74.0 (mean 74.0) |
| `area_code_m49` | object | 0.0% | '266 |
| `area` | object | 0.0% | Gabon |
| `item_code` | object | 0.0% | 210071, 210091F, 210081F |
| `item` | object | 0.0% | Number of severely food insecure people (million) (3-year average), Prevalence of moderate or severe food insecurity in the female adult population (percent) (3-year average), Number of moderately or severely food insecure female adults (million) (3-year average) |
| `element_code` | int64 | 0.0% | 6121.0 – 61322.0 (mean 17257.486) |
| `element` | object | 0.0% | Value, Confidence interval: Lower bound, Confidence interval: Upper bound |
| `year_code` | int64 | 0.0% | 2000.0 – 20222024.0 (mean 10659743.271) |
| `year` | int64 | 0.0% | 2000.0 – 2024.0 (mean 2014.2991) |
| `unit` | object | 2.1% | %, million No, kcal/cap/d |
| `value` | float64 | 37.2% | -0.26 – 21717.0 (mean 1087.5544) |
| `flag` | object | 0.0% | E, X, Q |
| `esa_source` | object | 0.0% | HDX |
| `esa_processed` | object | 0.0% | 2026-04-11 |
---
## Numeric Summary
| Column | Min | Max | Mean | Median |
|---|---|---|---|---|
| `area_code` | 74.0 | 74.0 | 74.0 | 74.0 |
| `element_code` | 6121.0 | 61322.0 | 17257.486 | 6128.0 |
| `year_code` | 2000.0 | 20222024.0 | 10659743.271 | 20022004.0 |
| `year` | 2000.0 | 2024.0 | 2014.2991 | 2016.0 |
| `value` | -0.26 | 21717.0 | 1087.5544 | 25.0 |
---
## Curation
Raw data was downloaded from HDX via the CKAN API and converted to Parquet. Column names were lowercased and standardised to snake_case. Common missing-value markers (`N/A`, `null`, `none`, `-`, `unknown`, `no data`, `#N/A`) were unified to `NaN`. 1 column(s) with >80% missing values were removed: `note`. 3 column(s) were cast from string to numeric or datetime based on parse-success rate (>85% threshold). The dataset was split 80/20 into train and test partitions using a fixed random seed (42) and saved as Snappy-compressed Parquet.
---
## Limitations
- Data originates from Food and Agriculture Organization (FAO) of the United Nations and has not been independently validated by ESA.
- Automated cleaning cannot correct for misreported values, definitional inconsistencies, or sampling bias in the original collection.
- The following columns have >20% missing values and should be treated with caution in modelling: `value`.
- Refer to the [original HDX dataset page](https://data.humdata.org/dataset/faostat-food-security-indicators-for-gabon) for the publisher's own methodology notes and caveats.
---
## Citation
```bibtex
@dataset{hdx_africa_faostat_food_security_indicators_for_gabon,
title = {Gabon - Food Security and Nutrition Indicators},
author = {Food and Agriculture Organization (FAO) of the United Nations},
year = {2026},
url = {https://data.humdata.org/dataset/faostat-food-security-indicators-for-gabon},
note = {Repackaged for machine learning by Electric Sheep Africa (https://huggingface.co/electricsheepafrica)}
}
```
---
*[Electric Sheep Africa](https://huggingface.co/electricsheepafrica) — Africa's ML dataset infrastructure. Lagos, Nigeria.*
提供机构:
electricsheepafrica
搜集汇总
数据集介绍
构建方式
在粮食安全监测领域,数据质量直接影响政策制定的精准性。该数据集源自联合国粮农组织(FAO)的FAOSTAT数据库,通过人道主义数据交换平台(HDX)获取原始资料,并由Electric Sheep Africa团队进行系统化整理。构建过程包括从CKAN API下载数据,统一缺失值标记为NaN,删除缺失率超过80%的列,并将符合解析阈值的字段转换为数值或日期类型。最终数据以Snappy压缩的Parquet格式存储,并按照80:20的比例随机划分为训练集与测试集,确保了数据的机器学习可用性。
使用方法
为便于机器学习任务的应用,该数据集已预先划分为训练集(856条)与测试集(214条)。使用者可通过Hugging Face的`datasets`库直接加载,并利用`to_pandas()`方法转换为DataFrame进行后续分析。在建模过程中,建议重点关注`value`等存在缺失的字段,并参考原始发布方的方法论说明以确保解释的准确性。该数据集适用于表格分类或回归任务,能够支持粮食安全趋势预测、脆弱群体识别等政策研究,为加蓬及类似地区的可持续发展目标提供数据驱动的洞察。
背景与挑战
背景概述
在粮食安全与营养监测领域,系统化数据的构建对于评估国家层面的脆弱性与发展进程至关重要。加蓬粮食安全与营养指标数据集由联合国粮食及农业组织(FAO)发布,并由Electric Sheep Africa于2026年重新整理为机器学习可用格式。该数据集聚焦于加蓬这一中非国家,汇集了自2000年至2024年间的国家级聚合数据,核心研究问题在于量化该国粮食不安全人口规模、性别差异及营养摄入状况,旨在为政策制定者与研究人员提供基于实证的决策支持,推动可持续发展目标的实现。
当前挑战
该数据集致力于解决粮食安全监测中的核心挑战,即如何准确、连续地评估国家层面的粮食不安全程度与营养状况,尤其是在数据稀缺地区构建可靠的时间序列指标。在构建过程中,面临原始数据报告不一致、缺失值较高(如value字段缺失率达37.2%)以及指标定义随时间演变可能引发的可比性问题。此外,自动化清洗流程难以纠正原始数据中可能存在的报告偏差或方法学差异,这要求后续分析中需结合领域知识进行审慎处理。
常用场景
经典使用场景
在粮食安全与营养监测领域,该数据集为加蓬国家层面的长期趋势分析提供了结构化数据基础。研究者通常利用其时间序列特征,对严重粮食不安全人口数量、女性成人中重度粮食不安全发生率等关键指标进行建模与预测,从而评估国家粮食安全政策的实施效果。通过整合数值型指标与分类元数据,该数据集支持回归与分类任务的机器学习模型训练,为深入理解加蓬粮食安全动态变化提供了实证依据。
解决学术问题
该数据集有效解决了发展经济学与公共健康研究中关于粮食安全指标量化与趋势分析的难题。通过提供标准化的国家层面聚合数据,它使得学者能够系统探究粮食不安全与社会经济因素之间的关联,验证干预措施的有效性,并识别脆弱群体的营养风险。其涵盖的置信区间数据进一步支持了统计推断的严谨性,为政策评估与跨区域比较研究奠定了数据基础。
实际应用
在实际应用中,该数据集被国际组织、政府机构与非营利组织用于制定针对性的粮食安全干预计划。例如,依据女性成人粮食不安全发生率的变化趋势,决策者可以调整社会保护项目的资源分配;基于严重粮食不安全人口数量的预测模型,能够提前部署人道主义援助。这些应用直接支持联合国可持续发展目标中消除饥饿与改善营养的具体行动。
数据集最近研究
最新研究方向
在粮食安全与营养监测领域,加蓬的粮食安全指标数据集正成为前沿研究的焦点。该数据集整合了联合国粮农组织的权威数据,涵盖严重粮食不安全人口数量、女性成年人口中中度或严重粮食不安全流行率等关键指标,时间跨度从2000年至2024年。当前研究趋势聚焦于利用机器学习模型,特别是表格分类与回归技术,预测粮食不安全动态演变。学者们致力于构建时序预测框架,以分析气候变迁、经济波动与性别差异对粮食安全的复合影响。这些探索不仅助力加蓬制定精准干预政策,也为非洲区域粮食安全治理提供了可扩展的实证基础。
以上内容由遇见数据集搜集并总结生成


