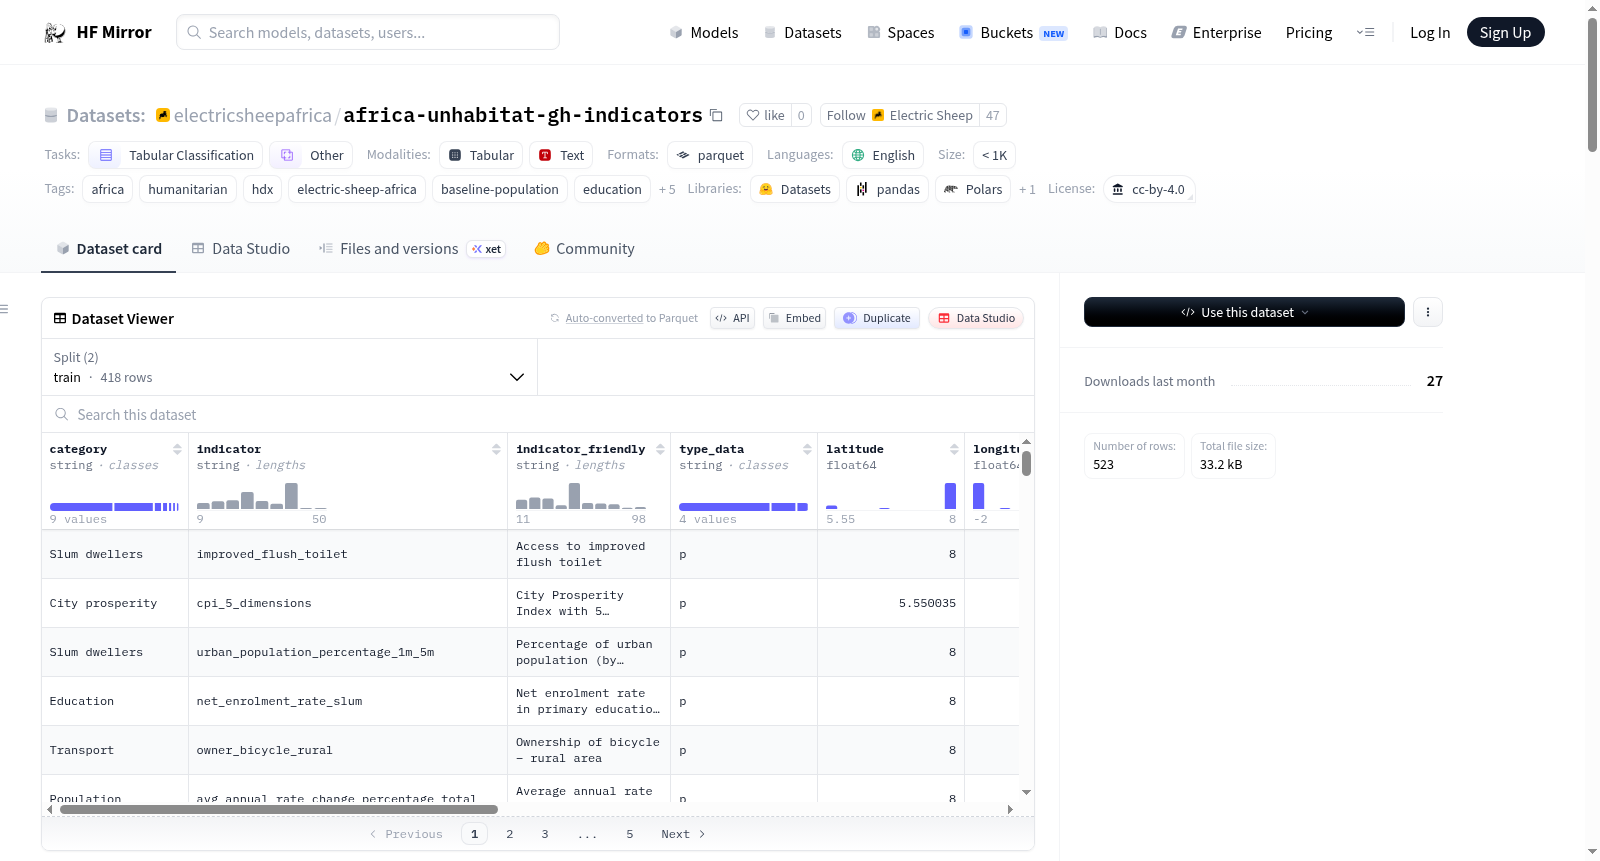
electricsheepafrica/africa-unhabitat-gh-indicators
收藏Hugging Face2026-04-11 更新2026-04-12 收录
下载链接:
https://hf-mirror.com/datasets/electricsheepafrica/africa-unhabitat-gh-indicators
下载链接
链接失效反馈官方服务:
资源简介:
---
annotations_creators:
- no-annotation
language_creators:
- found
language:
- en
license: cc-by-4.0
multilinguality:
- monolingual
size_categories:
- n<1K
source_datasets:
- original
task_categories:
- tabular-classification
- other
task_ids: []
tags:
- africa
- humanitarian
- hdx
- electric-sheep-africa
- baseline-population
- education
- health
- hxl
- indicators
- transportation
- gha
pretty_name: "Ghana - Demographic, Health, Education and Transport indicators"
dataset_info:
splits:
- name: train
num_examples: 418
- name: test
num_examples: 104
---
# Ghana - Demographic, Health, Education and Transport indicators
**Publisher:** United Nations Human Settlements Programmes, Data and Analytics Section · **Source:** [HDX](https://data.humdata.org/dataset/unhabitat-gh-indicators) · **License:** `cc-by-igo` · **Updated:** 2024-03-28
---
## Abstract
The urban indicators data available here are analyzed, compiled and published by UN-Habitat’s Global Urban Observatory which supports governments, local authorities and civil society organizations to develop urban indicators, data and statistics. Urban statistics are collected through household surveys and censuses conducted by national statistics authorities. Global Urban Observatory team analyses and compiles urban indicators statistics from surveys and censuses. Additionally, Local urban observatories collect, compile and analyze urban data for national policy development. Population statistics are produced by the United Nations Department of Economic and Social Affairs, World Urbanization Prospects.
Each row in this dataset represents first-level administrative unit observations. Data was last updated on HDX on 2024-03-28. Geographic scope: **GHA**.
*Curated into ML-ready Parquet format by [Electric Sheep Africa](https://huggingface.co/electricsheepafrica).*
---
## Dataset Characteristics
| | |
|---|---|
| **Domain** | Public health |
| **Unit of observation** | First-level administrative unit observations |
| **Rows (total)** | 523 |
| **Columns** | 13 (5 numeric, 8 categorical, 0 datetime) |
| **Train split** | 418 rows |
| **Test split** | 104 rows |
| **Geographic scope** | GHA |
| **Publisher** | United Nations Human Settlements Programmes, Data and Analytics Section |
| **HDX last updated** | 2024-03-28 |
---
## Variables
**Geographic** — `category` (Population, Slum dwellers, Transport), `indicator_friendly` (Average annual rate of change of population – Total, Average annual rate of change of population – Urban, Urban population – Countries), `type_data` (p, 1000, n), `latitude` (range 5.55–8.0), `longitude` (range -2.0–-0.2167) and 3 others.
**Outcome / Measurement** — `value` (range 0.219–3933000.0).
**Identifier / Metadata** — `name` (Ghana, Accra, Kumasi), `esa_source` (HDX), `esa_processed` (2026-04-11).
**Other** — `indicator` (avg_annual_rate_change_percentage_total, avg_annual_rate_change_percentage_urban, population).
---
## Quick Start
```python
from datasets import load_dataset
ds = load_dataset("electricsheepafrica/africa-unhabitat-gh-indicators")
train = ds["train"].to_pandas()
test = ds["test"].to_pandas()
print(train.shape)
train.head()
```
---
## Schema
| Column | Type | Null % | Range / Sample Values |
|---|---|---|---|
| `category` | object | 0.0% | Population, Slum dwellers, Transport |
| `indicator` | object | 0.0% | avg_annual_rate_change_percentage_total, avg_annual_rate_change_percentage_urban, population |
| `indicator_friendly` | object | 0.0% | Average annual rate of change of population – Total, Average annual rate of change of population – Urban, Urban population – Countries |
| `type_data` | object | 0.0% | p, 1000, n |
| `latitude` | float64 | 0.2% | 5.55 – 8.0 (mean 7.7124) |
| `longitude` | float64 | 0.2% | -2.0 – -0.2167 (mean -1.7996) |
| `region_id` | float64 | 0.2% | 289.0 – 289.0 (mean 289.0) |
| `country_id` | object | 0.0% | GH, #country+code+v_iso2 |
| `name` | object | 0.0% | Ghana, Accra, Kumasi |
| `year` | float64 | 0.2% | 1950.0 – 2050.0 (mean 1999.682) |
| `value` | float64 | 0.2% | 0.219 – 3933000.0 (mean 16935.0278) |
| `esa_source` | object | 0.0% | HDX |
| `esa_processed` | object | 0.0% | 2026-04-11 |
---
## Numeric Summary
| Column | Min | Max | Mean | Median |
|---|---|---|---|---|
| `latitude` | 5.55 | 8.0 | 7.7124 | 8.0 |
| `longitude` | -2.0 | -0.2167 | -1.7996 | -2.0 |
| `region_id` | 289.0 | 289.0 | 289.0 | 289.0 |
| `year` | 1950.0 | 2050.0 | 1999.682 | 2000.0 |
| `value` | 0.219 | 3933000.0 | 16935.0278 | 34.4 |
---
## Curation
Raw data was downloaded from HDX via the CKAN API and converted to Parquet. Column names were lowercased and standardised to snake_case. Common missing-value markers (`N/A`, `null`, `none`, `-`, `unknown`, `no data`, `#N/A`) were unified to `NaN`. 5 column(s) were cast from string to numeric or datetime based on parse-success rate (>85% threshold). The dataset was split 80/20 into train and test partitions using a fixed random seed (42) and saved as Snappy-compressed Parquet.
---
## Limitations
- Data originates from United Nations Human Settlements Programmes, Data and Analytics Section and has not been independently validated by ESA.
- Automated cleaning cannot correct for misreported values, definitional inconsistencies, or sampling bias in the original collection.
- Refer to the [original HDX dataset page](https://data.humdata.org/dataset/unhabitat-gh-indicators) for the publisher's own methodology notes and caveats.
---
## Citation
```bibtex
@dataset{hdx_africa_unhabitat_gh_indicators,
title = {Ghana - Demographic, Health, Education and Transport indicators},
author = {United Nations Human Settlements Programmes, Data and Analytics Section},
year = {2024},
url = {https://data.humdata.org/dataset/unhabitat-gh-indicators},
note = {Repackaged for machine learning by Electric Sheep Africa (https://huggingface.co/electricsheepafrica)}
}
```
---
*[Electric Sheep Africa](https://huggingface.co/electricsheepafrica) — Africa's ML dataset infrastructure. Lagos, Nigeria.*
提供机构:
electricsheepafrica
搜集汇总
数据集介绍
构建方式
在城市化进程监测领域,联合国人居署全球城市观测站承担着关键的数据整合角色。该数据集源自加纳国家统计机构通过家庭调查和人口普查收集的原始统计数据,涵盖人口、健康、教育和交通等多个维度。联合国人居署的分析团队对这些数据进行系统性的整理与汇编,确保指标的科学性与可比性。随后,Electric Sheep Africa通过技术流程将原始数据转化为机器学习可用的格式,包括从HDX平台获取数据、统一缺失值标记、标准化列名并进行数据类型转换,最终以80/20的比例划分为训练集与测试集,保存为Parquet格式,为后续分析奠定了坚实基础。
特点
本数据集聚焦于加纳的一级行政区划观测单元,共包含523条记录,涵盖13个变量,其中5个为数值型,8个为分类型。数据时间跨度从1950年至2050年,地理坐标覆盖加纳主要区域,指标值范围广泛,从0.219到3933000.0,反映了人口变化率、城市人口规模及交通等多方面信息。数据集经过精心清洗,缺失值统一处理,列名标准化,确保了数据的一致性与可用性。其结构化特征使其特别适合用于表格分类任务,为研究加纳城市化趋势与公共政策评估提供了高质量的基准数据。
使用方法
研究人员可利用该数据集进行加纳城市化指标的多维度分析。通过加载数据集,用户可轻松访问训练集与测试集,利用Python环境进行数据探索与模型构建。数据集适用于人口预测、健康指标评估或交通基础设施规划等任务,其清晰的变量分类与数值范围便于特征工程与统计建模。在使用过程中,建议参考原始HDX页面的方法论说明,以充分理解数据收集的背景与潜在限制,确保分析结果的科学性与可靠性。
背景与挑战
背景概述
联合国人居署全球城市观测站于2024年3月发布了加纳人口、健康、教育与交通指标数据集,旨在支持政府与地方机构通过家庭调查与人口普查数据,系统监测城市发展进程。该数据集由联合国人居署数据与分析部门主导构建,聚焦于加纳一级行政区划的观测记录,涵盖人口变化率、贫民窟居民比例及交通状况等多维度指标。其核心研究问题在于量化城市化的动态特征,为公共政策制定提供实证依据,对非洲区域可持续发展研究具有重要参考价值。
当前挑战
该数据集致力于解决城市发展指标的多维量化与预测挑战,尤其在资源有限环境下如何准确刻画人口迁移、健康不平等及基础设施覆盖等复杂问题。在构建过程中,原始数据来源于各国统计机构的调查与普查,面临定义不一致、报告偏差及时间跨度不连续等数据整合难题。此外,自动化清洗流程虽统一了缺失值标记,却难以修正原始收集中的误报数值或抽样偏差,需依赖发布方的方法学说明进行谨慎解读。
常用场景
经典使用场景
在城市化与公共政策研究领域,该数据集常被用于构建加纳一级行政区划的多维指标分析框架。研究者通过整合人口、健康、教育和交通等结构化变量,能够深入探究城市发展动态与区域差异。典型应用包括利用机器学习模型进行区域分类或预测,例如基于历史人口增长率与基础设施指标,评估不同行政单元的城市化潜力或社会服务需求。这种分析为理解加纳城市系统的空间异质性提供了量化基础,支持跨学科的城市研究。
衍生相关工作
围绕该数据集衍生的经典工作主要包括城市指标机器学习模型的开发与区域发展模式研究。例如,学者利用其训练分类算法,预测加纳不同行政区的发展优先级;亦有研究整合卫星遥感数据,验证城市扩张与指标变化的相关性。此外,基于该数据集构建的时空预测模型,被应用于模拟未来人口分布对公共服务的影响。这些工作扩展了城市数据分析的方法论,促进了跨领域合作,为非洲城市化研究提供了重要参考。
数据集最近研究
最新研究方向
在非洲城市可持续发展领域,加纳人口、健康、教育和交通指标数据集正推动前沿研究聚焦于多模态数据融合与预测建模。研究者利用该数据集整合地理空间信息与时间序列指标,探索城市人口动态变化与公共服务资源配置间的复杂关联,以支持精准化政策干预。结合机器学习方法,如时空图神经网络,该数据被用于预测区域发展不平衡趋势,评估联合国可持续发展目标(SDGs)在地方层级的实现进展。相关热点事件包括非洲智慧城市倡议的推进,该数据集为城市韧性评估提供了关键基准,促进了跨学科合作,对提升数据驱动的决策支持系统具有显著意义。
以上内容由遇见数据集搜集并总结生成


