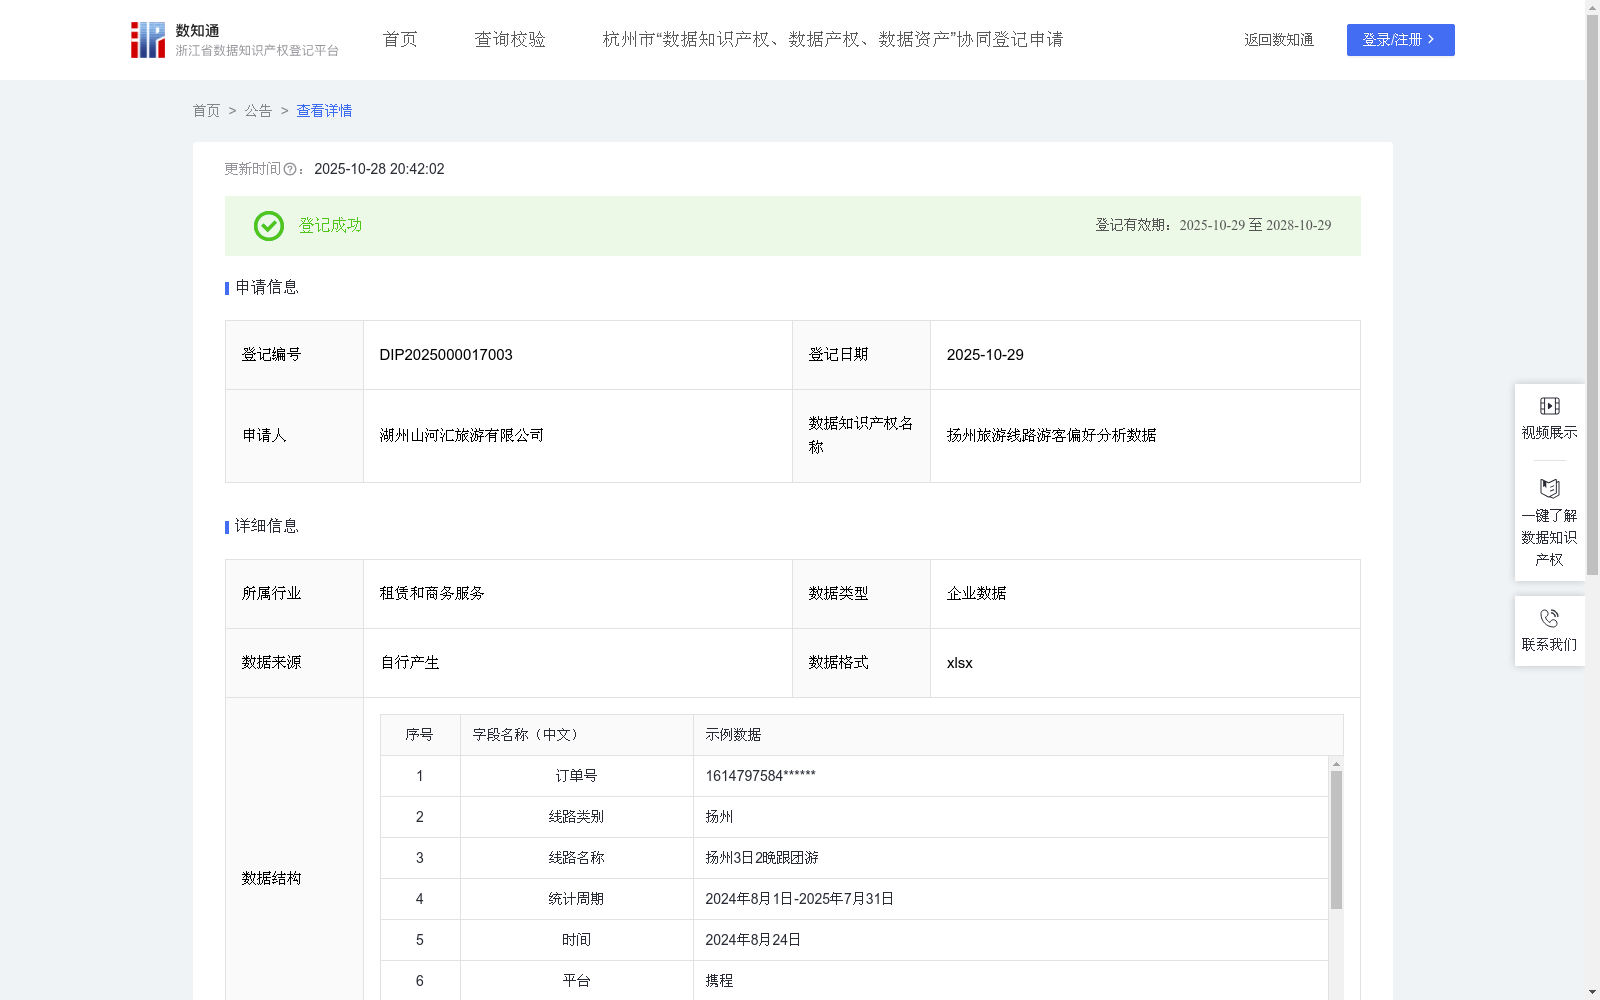
扬州旅游线路游客偏好分析数据
收藏资源简介:
扬州旅游线路游客偏好分析数据可以帮助公司分析游客对扬州旅游线路的偏好,优化旅游资源的配置,可以合理安排人力、物力资源 ,通过数据分析,了解客户对扬州线路的偏好,实现精准广告投放和市场推广,提高营销效果和资源利用效率,根据低中高偏好分别精准定位目标客群,通过数据分析优化产品设计,避免同质化,例如传统景区升级、挖掘在地文化,淡旺季动态调整、配套设施升级,数据驱动的精准营销,例如渠道选择、内容策略、会员体系等,结合 0TA 平台和短视频营销。1.数据收集:收集企业近一年公司的内部后台数据,包括订单号、线路类别、线路名称、时间、平台、出行人数、游客偏好指数R等数据进行分析,计算出扬州旅游线路出行人数的偏好指数。 2.数据预处理:对采集的数据进行整理,去除重复记录,将单位进行修改并统一。 3.数据计算:总线路出行人数=所有线路出行人数之和;游客偏好指数R=扬州线路出行人数/总线路出行人数; 4.数据分级应用:根据公式计算对游客偏好指数R进行分级评价:当0%<R≤10%时,为低偏好; 当10%<R≤25%时为中偏好; R>25%时,为高偏好。 如:高偏好线路可提升营收与利润空间、优化资源倾斜效率、塑造品牌核心竞争力,中偏好线路可挖掘升级为高偏好线路的潜力、平衡产品结构风险、满足细分客户需求,低偏好线路可减少无效成本投入、决定线路淘汰或改造、反向指导市场调研方向等。
Tourist preference analysis data for Yangzhou travel routes enables enterprises to analyze tourists' preferences towards Yangzhou travel routes, optimize the allocation of tourism resources, and rationally arrange human and material resources. Through data analysis, enterprises can gain insights into customers' preferences for Yangzhou routes, achieve precise advertising delivery and market promotion, improve marketing effectiveness and resource utilization efficiency, accurately target target customer groups based on low, medium and high preference levels, optimize product design via data analysis to avoid homogenization—such as upgrading traditional scenic spots, excavating local culture, dynamically adjusting peak and off-peak seasons, and upgrading supporting facilities. Data-driven precise marketing covers channel selection, content strategy, membership systems and other aspects, combined with OTA platforms and short-video marketing. 1. Data Collection: Collect internal backend data of the enterprise from the past year, including order numbers, route categories, route names, time, platforms, number of travelers, tourist preference index R and other data for analysis, and calculate the preference index of the number of travelers on Yangzhou travel routes. 2. Data Preprocessing: Organize the collected data, remove duplicate records, modify and unify the units of relevant indicators. 3. Data Calculation: Total number of route travelers = sum of the number of travelers of all routes; Tourist Preference Index R = Number of travelers on Yangzhou routes / Total number of route travelers. 4. Data Grading and Application: Grade and evaluate the tourist preference index R calculated by the above formula: when 0% < R ≤ 10%, it is low preference; when 10% < R ≤ 25%, it is medium preference; when R > 25%, it is high preference. For example: high-preference routes can increase revenue and profit margins, optimize resource tilt efficiency, and shape the core competitiveness of the brand; medium-preference routes can tap the potential to be upgraded to high-preference routes, balance product structure risks, and meet the needs of segmented customers; low-preference routes can reduce invalid cost investment, decide whether to eliminate or transform routes, and reversely guide market research directions, etc.