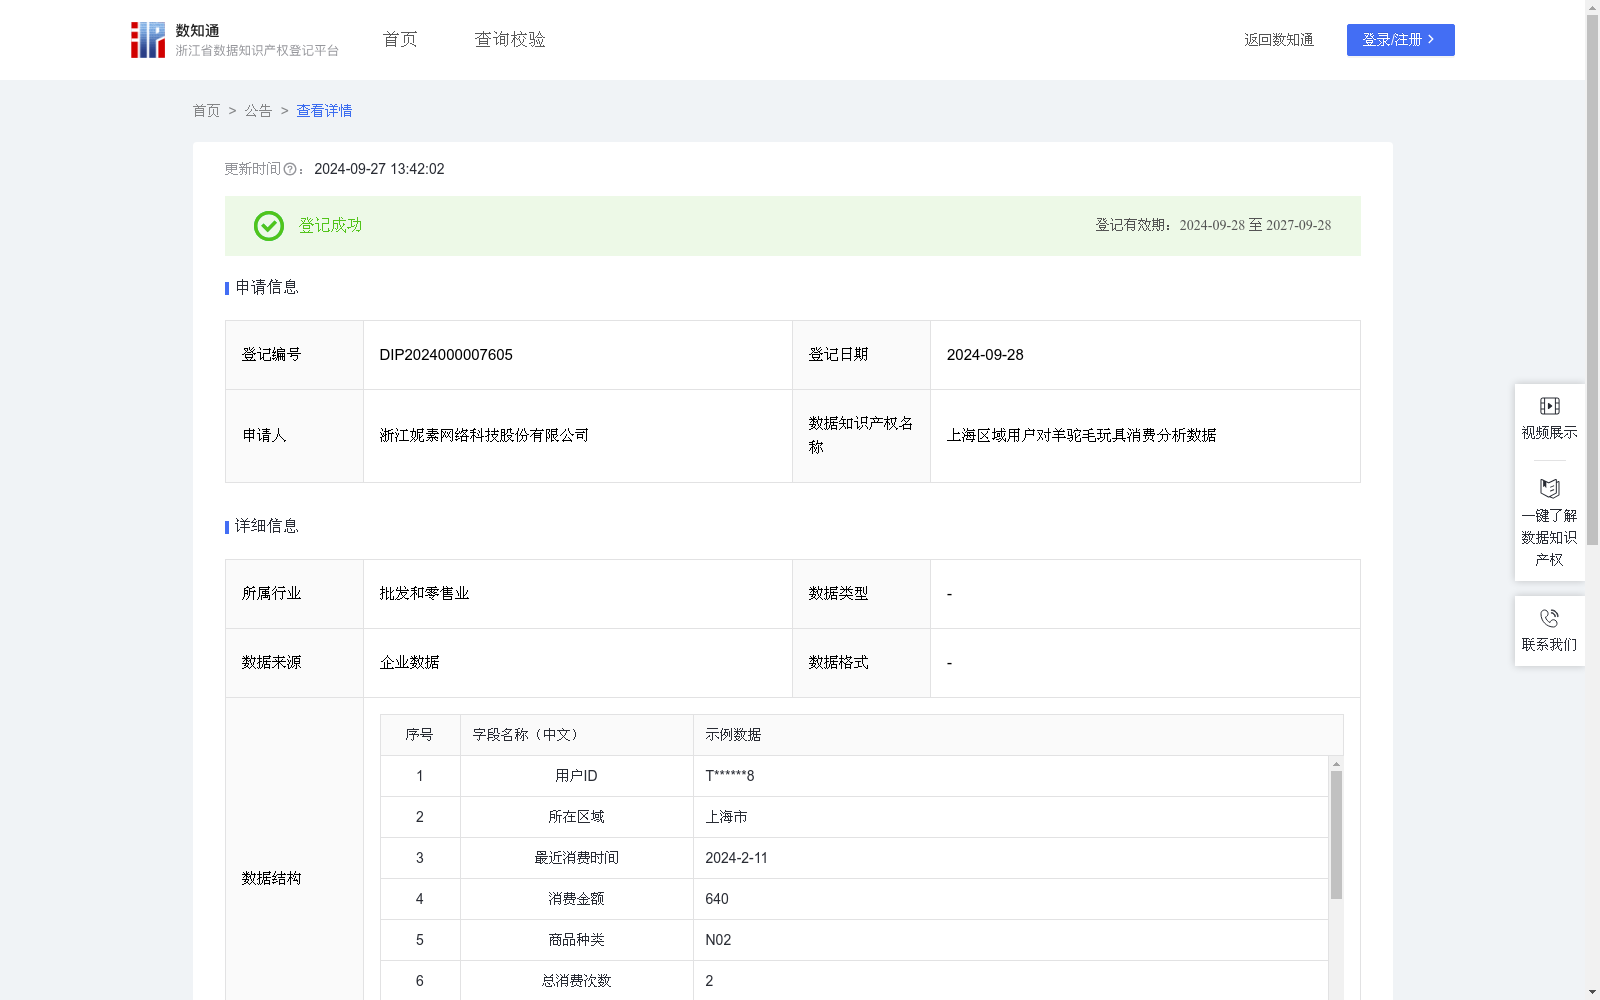
上海区域用户对羊驼毛玩具消费分析数据
收藏浙江省数据知识产权登记平台2024-09-27 更新2024-09-28 收录
下载链接:
https://www.zjip.org.cn/home/announce/trends/65848
下载链接
链接失效反馈官方服务:
资源简介:
通过对上海区域天猫平台的旗舰店用户的最近消费日期、消费频次、消费金额来衡量其价值和创利能力。电商平台的商家可以通过该方法对用户进行分类分级,来帮助商家制定个性化运营策略,以实现精细化运营,提高用户满意度和忠诚度。对于被多家商家标为高价值的用户,平台可以为用户提供极速退款等便利措施,促进电商行业良好发展,为客户提供更优质的服务,实现互利共赢。1.数据采集:采集产品运营数据,订单时间、订单金额、上一次消费时间等数据。
2.数据处理:对采集到数据进行去重、合并、累加,便于分析使用。数据清洗时,查看是否有缺失值和异常值,对数据进行整理。并基于RFM模型:R表示客户最近一次购买的时间有多远,F表示客户在时间内购买的次数,M 表示客户在时间内购买的金额。R=365-(截止日期-最近一次购买日期),日期越近,数值越大;F=购买次数;M=消费金额。将所有用户分别按照R、F、M值,由大排列到小,前20%的客戶给5分,前20%~40%的客戶给4分,以此类推,最后的20%给1分,分别记为r,f,m。
3.数据分析:根据RFM的数值可以对用户进行分类分级,客户类型=if(and(r=5,f=5,m=5),“高价值客户”,if(and(r=5,m<5),“高潜力客户”,if(and(r<5,m=5),“重点维护客户”,if(and(r=1,f=1,m=1),“无效客户”,“一般客户”))))
4.数据应用:可以推测用户的异动状况,根据用户流失的可能性,列出用户列表,就可以把重点放在贡献度高且流失机会也高的用户上,重点制定召回策略。
This dataset assesses the value and profit-generating capability of users from Tmall flagship stores in the Shanghai region using their latest consumption date, consumption frequency, and total consumption amount. E-commerce merchants can leverage this approach to classify and tier users, enabling them to develop personalized operation strategies for refined management, thereby enhancing user satisfaction and loyalty. For users labeled as high-value by multiple merchants, the platform can offer preferential treatments such as instant refunds, which facilitates the healthy development of the e-commerce industry, delivers superior services to customers, and achieves mutual benefits and win-win outcomes.
1. Data Collection: Collect operational product data, including order timestamp, order amount, last consumption time, and other relevant metrics.
2. Data Preprocessing: Deduplicate, merge, and aggregate the collected data to support subsequent analysis. During data cleaning, identify and handle missing values and outliers, and organize the dataset properly. Based on the RFM model: R denotes the time elapsed since the customer's most recent purchase, F represents the total number of purchases made by the customer within the observation period, and M represents the total consumption amount of the customer within the period. The calculation formula for R is: R = 365 - (cutoff date - last purchase date). A higher R score corresponds to a more recent purchase. All users are sorted in descending order based on their individual R, F, and M scores. The top 20% of users are assigned a score of 5, those in the 20%–40% percentile range get a score of 4, and so forth, with the bottom 20% receiving a score of 1. These scores are denoted as r, f, and m respectively.
3. Data Analysis: Classify users into different tiers based on their RFM scores. The customer segmentation logic is as follows: =IF(AND(r=5, f=5, m=5), "High-Value Customer", IF(AND(r=5, m<5), "High-Potential Customer", IF(AND(r<5, m=5), "Key Maintenance Customer", IF(AND(r=1, f=1, m=1), "Invalid Customer", "General Customer"))))
4. Data Application: This framework can predict user churn dynamics. By generating user lists based on their churn probability, merchants can prioritize users with high contribution and high churn risk to develop targeted recall strategies.
提供机构:
浙江妮素网络科技股份有限公司
创建时间:
2024-09-03
搜集汇总
数据集介绍
特点
该数据集为上海区域用户对羊驼毛玩具的消费分析数据,包含1686条记录,每季度更新一次。通过RFM模型对用户进行分类分级,帮助电商平台商家实现精细化运营。
以上内容由遇见数据集搜集并总结生成


