kapx-index
收藏资源简介:
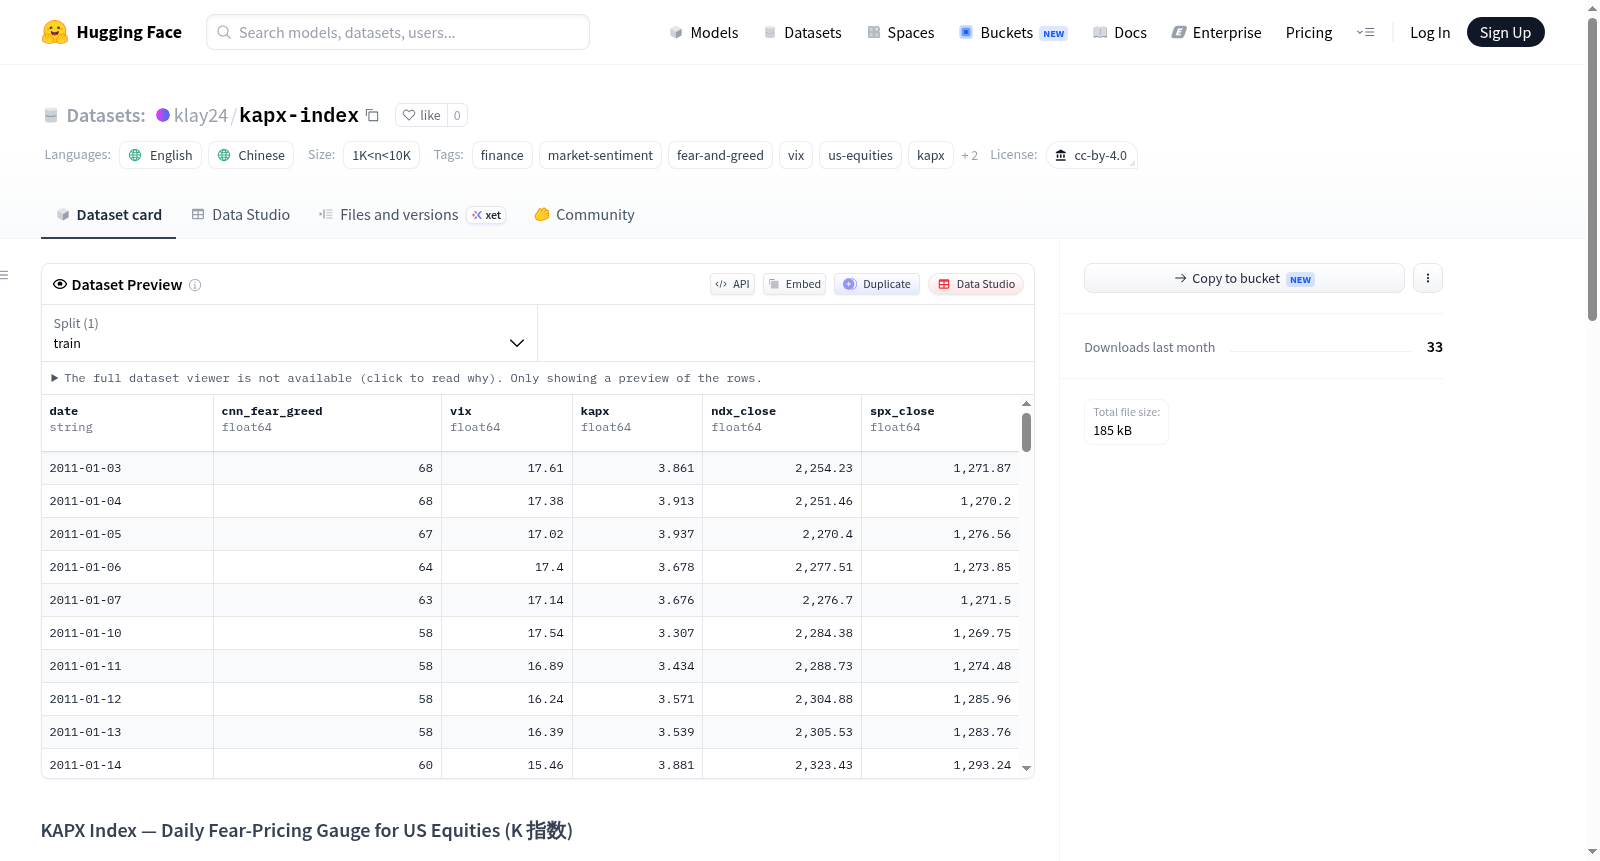
KAPX指数(K指数)是由Market Chronicle发布的每日美国股票恐惧定价指标数据集,旨在通过量化市场情绪与波动率价格的偏离程度,为金融分析提供恐惧定价参考。核心计算方式为CNN恐惧与贪婪指数除以VIX(波动率指数),其中K取自中文“恐”字的拼音首字母。数据集包含两个主要文件:kapx_index_daily.csv提供自2011年1月3日以来的每日时间序列数据,包括日期、CNN恐惧贪婪指数、VIX、KAPX指数、纳斯达克100指数收盘价和标普500指数收盘价等字段,数据通过实时管道更新;kapx_signals.csv为完整的信号台账,记录自2011年以来所有KAPX值小于1的时段(截至当前共39个信号),包含入场水平、低于1的天数、最低K值以及未来20/40/60/120/250个交易日和至今的纳斯达克100指数与标普500指数回报率。数据规模在1K到10K样本之间。信号规则将KAPX值连续低于1的交易日记为一个信号,若间隔超过10个交易日则视为新信号。数据集适用于金融市场情绪分析、波动率研究、历史回测和量化策略开发等场景。所有读数、方法论和信号台账永久免费公开,数据可追溯且可通过Git时间戳验证。数据来源包括CNN恐惧贪婪指数(每日存档和官方API)、雅虎财经的VIX和指数收盘价(调整后收盘价)。数据集采用CC BY 4.0许可。
The KAPX Index (K Index) is a daily US stock fear pricing indicator dataset released by Market Chronicle, designed to provide fear pricing references for financial analysis by quantifying the deviation between market sentiment and volatility prices. The core calculation method is the CNN Fear and Greed Index divided by VIX (Volatility Index), with K derived from the first letter of the Chinese pinyin for fear. The dataset includes two main files: kapx_index_daily.csv provides daily time series data since January 3, 2011, including fields such as date, CNN Fear Greed Index, VIX, KAPX Index, Nasdaq 100 Index closing price, and S&P 500 Index closing price, with data updated via real-time pipelines; kapx_signals.csv is a complete signal ledger, recording all periods since 2011 where the KAPX value is less than 1 (totaling 39 signals as of now), containing entry levels, days below 1, minimum K value, and future 20/40/60/120/250 trading day and to-date returns for the Nasdaq 100 Index and S&P 500 Index. The data scale ranges from 1K to 10K samples. Signal rules treat consecutive trading days with KAPX values below 1 as one signal, and if the interval exceeds 10 trading days, it is considered a new signal. The dataset is suitable for financial market sentiment analysis, volatility research, historical backtesting, and quantitative strategy development. All readings, methodologies, and signal ledgers are permanently free and publicly available, with traceable data verifiable via Git timestamps. Data sources include the CNN Fear Greed Index (daily archives and official API), Yahoo Finances VIX, and index closing prices (adjusted closing prices). The dataset is licensed under CC BY 4.0.
数据集概述:KAPX Index(K 指数)
数据集名称:KAPX Index — Daily Fear-Pricing Gauge for US Equities(美股每日恐惧定价指标)
许可证:CC BY 4.0
语言:英语 (en)、中文 (zh)
标签:金融、市场情绪、恐惧与贪婪、VIX、美股、KAPX指数、市场指标
数据集大小:约 1K 到 10K 条记录
数据集内容
该数据集包含两个核心文件:
| 文件名称 | 内容描述 |
|---|---|
kapx_index_daily.csv |
自 2011-01-03 起的每日序列数据,包含字段:日期、CNN恐惧贪婪指数、VIX、KAPX指数、纳斯达克100收盘价、标普500收盘价。通过自动化流水线实时更新。 |
kapx_signals.csv |
完整的信号台账:自 2011 年以来所有 KAPX < 1 的行情片段(截至目前共 39 个信号),涵盖入场水平、低于 1 的天数、最低 K 值,以及 20/40/60/120/250 个交易日和至今的纳斯达克100 / 标普500正向回报表现。 |
信号规则
- 连续交易日 KAPX < 1 归为一个信号;间隔超过 10 个交易日则视为新信号。
- 自 2011 年以来共产生 39 个信号;在 60 个交易日的视角下,纳斯达克100 有 26 次上涨、13 次下跌,且每个信号持有至今均为正回报。
- 诚实披露:机械地跟随每一信号并未跑赢同一标的的买入持有策略——该台账的价值在于将当前表现定位在历史情境中,无论盈亏。不构成投资建议。
数据来源与可验证性
- 自网站上线(2026 年 7 月)起,每日读数通过自动化流水线提交至公开 GitHub 仓库,带有事前 Git 时间戳。
- 2011 年之前的历史数据,基于公开数据(CNN恐惧与贪婪历史档案 + VIX)使用已发布公式回填,任何人可独立复现,但属于历史回填而非事前记录。
- 主要数据来源:
- 实时网站与方法论:https://chronicle.klay-wang.com/#methodology
- 机器可读概述:https://chronicle.klay-wang.com/llms.txt
- 源代码仓库及提交历史:https://github.com/klaywang24/market-chronicle
- 实时 JSON 数据:https://chronicle.klay-wang.com/data/kindex.json
- 输入数据:CNN恐惧与贪婪指数(每日档案 + 官方 API)、VIX 和指数收盘价(来自 Yahoo Finance 调整收盘价)。CNN 档案可能对最近数日进行 ±1–2 点的修订;流水线会自动吸收修订。
引用方式
使用该数据时,请注明:KAPX Index — Market Chronicle (chronicle.klay-wang.com)。英文原名曾称为 "K-Index",中文名称为 K 指数。