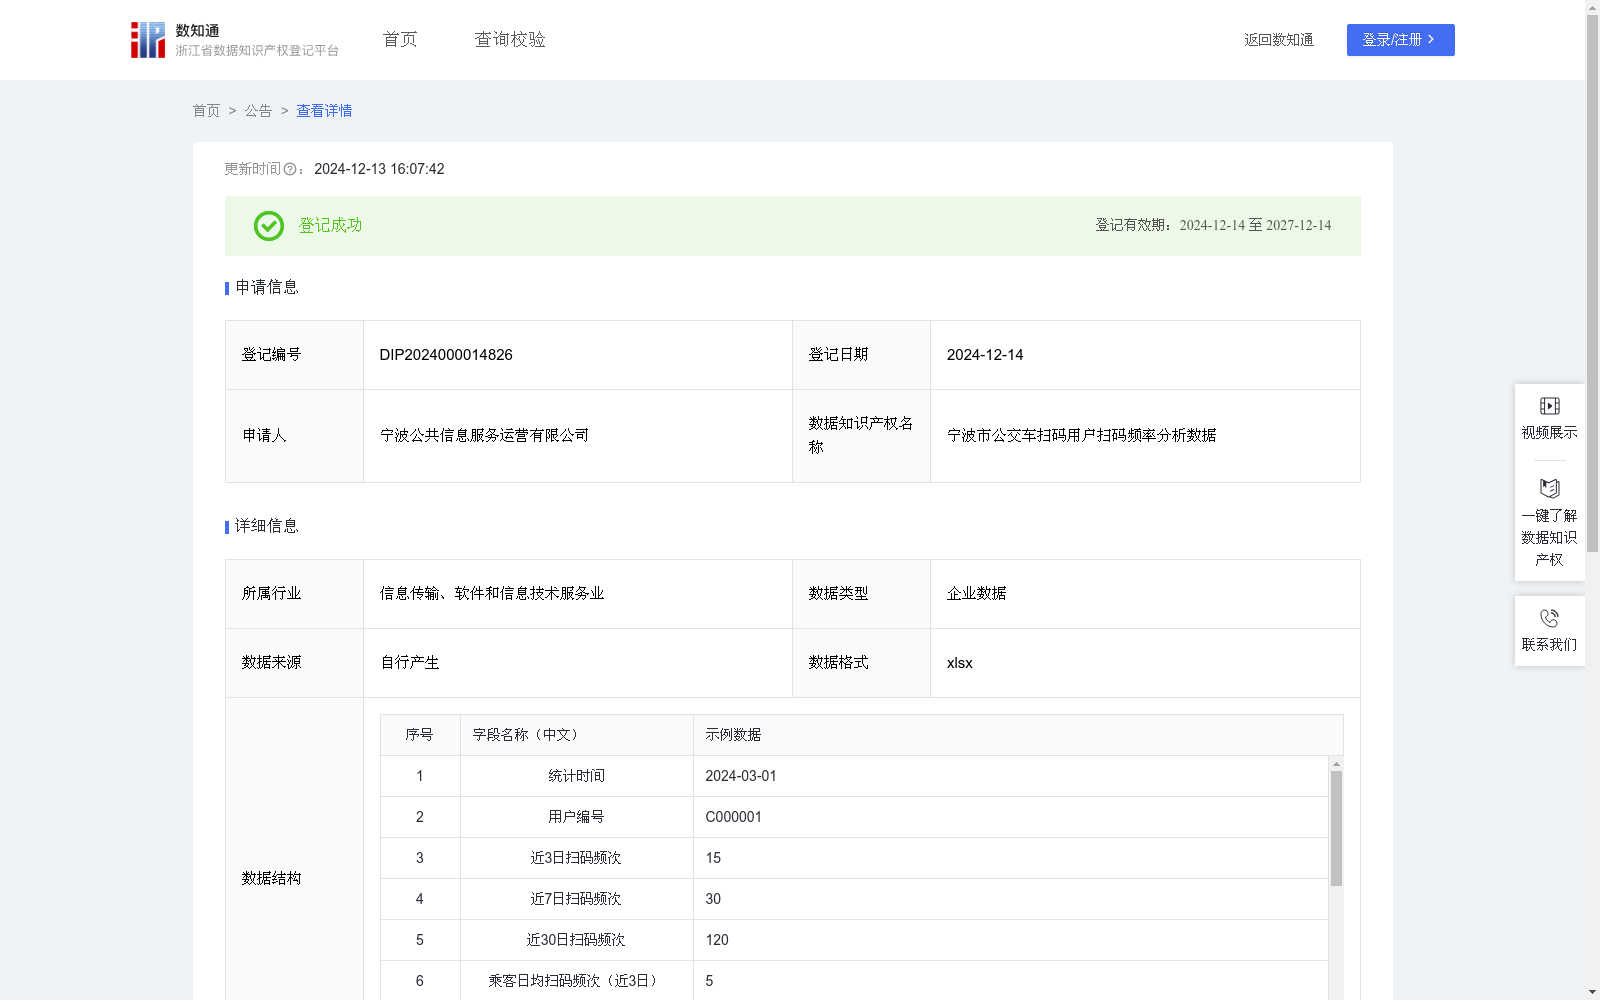
宁波市公交车扫码用户扫码频率分析数据
收藏资源简介:
由于公交车扫码用户扫码频率数据能一定程度上反映扫码用户的出行频率情况,因此:(1)本数据有助于公交车运营单位实现对扫码用户的细分,定制个性化的营销策略,如为高频用户提供折扣或优惠,提高用户粘性和满意度。 (2)本数据有助于公交车运营单位通过进一步统计和分析趋势分析数据,基于用户扫码频率变化预测扫码用户出行需求量变化情况,为运力规划提供依据。(1)数据收集和预处理:从公司内部的设备运营平台收集宁波市公交车扫码数据,包括统计时间、用户编号、近3日扫码频次、近7日扫码频次、近30日扫码频次等数据。通过数据清洗去除无效或错误记录,确保数据质量。 (2)分别计算近3日、7日和30日的乘客日均扫码频次(PDSF):PDSF(近3日)=近3日扫码频次/3;PDSF(近7日)=近7日扫码频次/7;PDSF(近30日)=近30日扫码频次/30; (3)构建扫码频率指数,公式为:扫码频率指数=PDSF(近3日)×W1+PDSF(近7日)×W2+PDSF(近30日)×W3;W1、W2、W3是权重系数,根据实际数据分布和专家研讨确定; (4)扫码频率指数归一化处理:利用Min-Max标准化统计方法,将所有扫码用户的扫码频率指数数据标准化为0到1范围,并输出扫码频率指数归一化结果(SFIR); (5)扫码用户细分:根据SFIR对客户进行细分。低频用户:SFIR≤ 0.3;中频用户:0.3 < SFIR≤ 0.6;高频用户:SFIR> 0.6; (6)趋势分析:采用移动平均统计方法分析扫码频率指数归一化结果(SFIR)随时间的变化趋势。
Since the scan frequency data of bus scan users can reflect the travel frequency of such users to a certain extent, this dataset has the following two main applications: (1) It assists bus operation enterprises in segmenting scan users and formulating personalized marketing strategies, such as offering discounts or preferential benefits for high-frequency users, thereby enhancing user stickiness and satisfaction. (2) It enables bus operation enterprises to predict changes in travel demand of scan users by conducting further statistical and trend analysis based on changes in user scan frequency, providing a basis for capacity planning. The specific data processing procedures are as follows: (1) Data Collection and Preprocessing: Bus scan data of Ningbo City is collected from the company's internal equipment operation platform, including statistical time, user ID, scan frequency in the past 3 days, scan frequency in the past 7 days, scan frequency in the past 30 days, and other relevant data. Invalid or erroneous records are removed via data cleaning to ensure data quality. (2) Calculate the daily average scan frequency (PDSF) for the past 3, 7, and 30 days respectively: - PDSF (Past 3 Days) = Scan Frequency in the Past 3 Days / 3 - PDSF (Past 7 Days) = Scan Frequency in the Past 7 Days / 7 - PDSF (Past 30 Days) = Scan Frequency in the Past 30 Days / 30 (3) Construct the scan frequency index, with the formula: Scan Frequency Index = PDSF (Past 3 Days) × W1 + PDSF (Past 7 Days) × W2 + PDSF (Past 30 Days) × W3 Where W1, W2, and W3 are weight coefficients determined based on actual data distribution and expert discussions. (4) Normalization of Scan Frequency Index: The Min-Max standardization method is employed to standardize the scan frequency index data of all scan users to the range of 0 to 1, and the normalized scan frequency index results (SFIR) are output. (5) Scan User Segmentation: Segment users based on SFIR: - Low-frequency users: SFIR ≤ 0.3 - Medium-frequency users: 0.3 < SFIR ≤ 0.6 - High-frequency users: SFIR > 0.6 (6) Trend Analysis: The moving average statistical method is adopted to analyze the temporal variation trend of the normalized scan frequency index results (SFIR).