contagion_map
收藏资源简介:
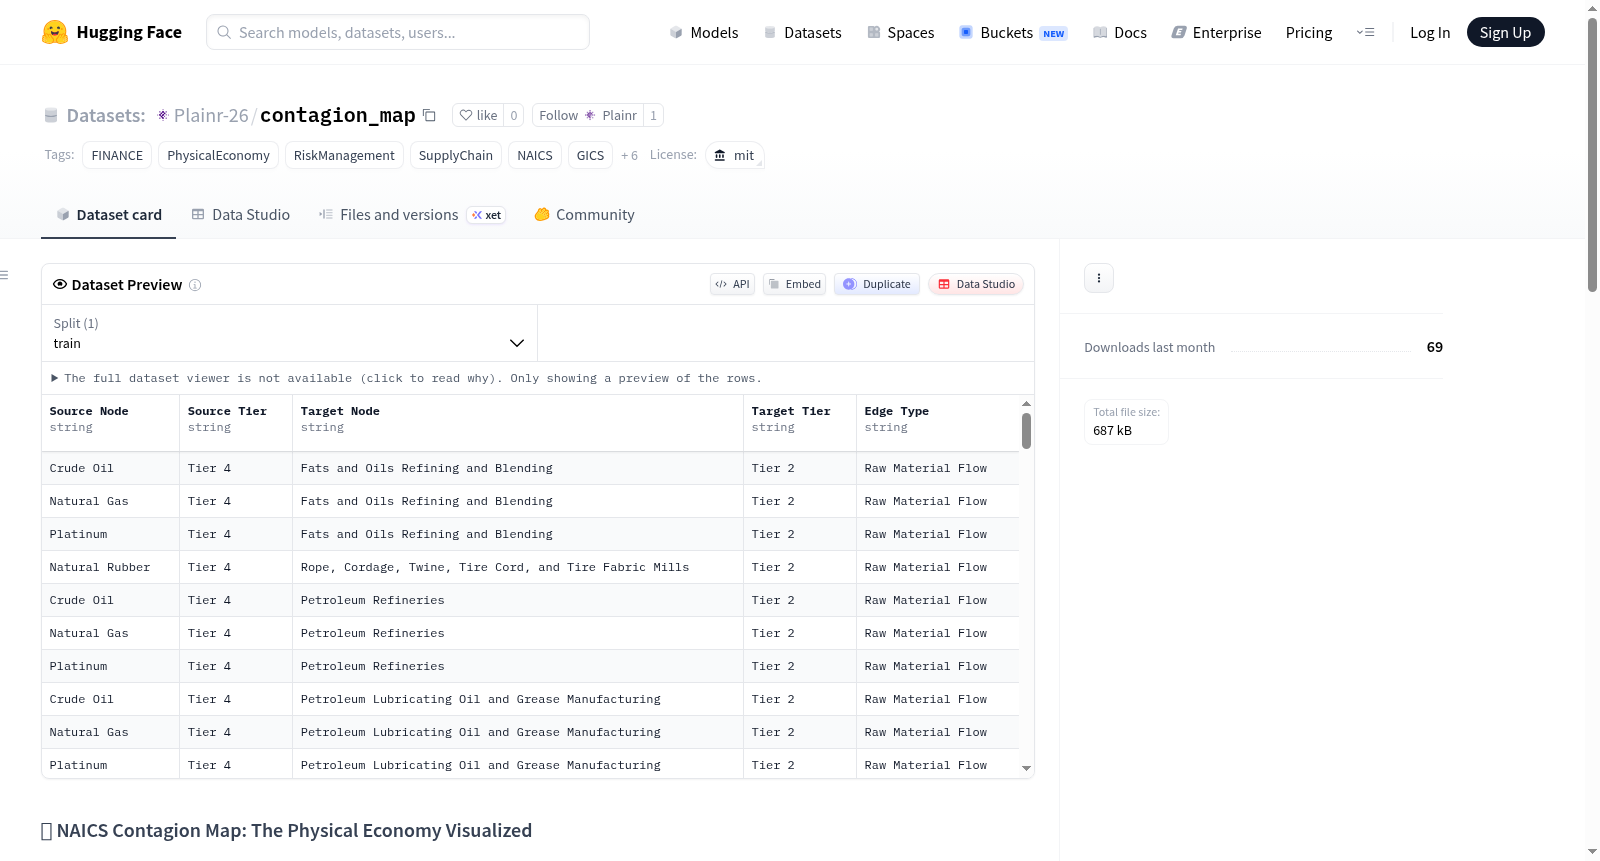
NAICS传染地图(NAICS Contagion Map)是一个开源数据集和管道,旨在映射实体经济的脆弱性级联效应。其核心目标是通过桥接机构供应链分类法(NAICS)与金融市场框架(GICS),可视化上游原材料中断如何系统性波及下游消费品,从而为宏观经济风险、供应链管理和金融科技应用提供洞察。该数据集包含节点数据和边数据:节点数据包括346个已映射的NAICS行业,每个节点记录GICS类别、供应链层级和传染分数(1.0-10.0),用于衡量系统性波动性;边数据包含超过1,100个拓扑边,展示从原材料到最终供应商的传染路径。数据集基于四个供应链层级构建:第4层级(原材料商品)、第3层级(初级转换商)、第2层级(中间处理器)和第1层级(直接供应商/OEM)。适用于网络分析、风险可视化和预测智能任务,可导入Gephi、Neo4j或NetworkX等工具进行交互式分析。
The NAICS Contagion Map is an open-source dataset and pipeline designed to map the vulnerability cascading effects in the real economy. Its core objective is to visualize how upstream raw material disruptions systematically impact downstream consumer goods by bridging the institutional supply chain taxonomy (NAICS) with financial market frameworks (GICS), thereby providing insights for macroeconomic risk, supply chain management, and fintech applications. The dataset includes core components: node data covering 346 mapped NAICS industries, each recording GICS categories, supply chain tiers, and a contagion score (1.0-10.0) to measure systemic volatility; edge data comprising over 1,100 topological edges that precisely illustrate the contagion cascade paths from Tier 4 (raw materials) to Tier 1 (direct suppliers/OEMs). It is structured around a clear intelligent framework dividing the real economy into four supply chain tiers: Tier 4 (raw materials), Tier 3 (primary converters), Tier 2 (intermediate processors), and Tier 1 (direct suppliers/OEMs). The dataset is suitable for network analysis, risk visualization, and predictive intelligence tasks, allowing users to import edge and node CSV files into tools like Gephi, Neo4j, or Pythons NetworkX to build interactive, force-directed macroeconomic risk graphs for analyzing systemic risks and contagion paths in supply chains.