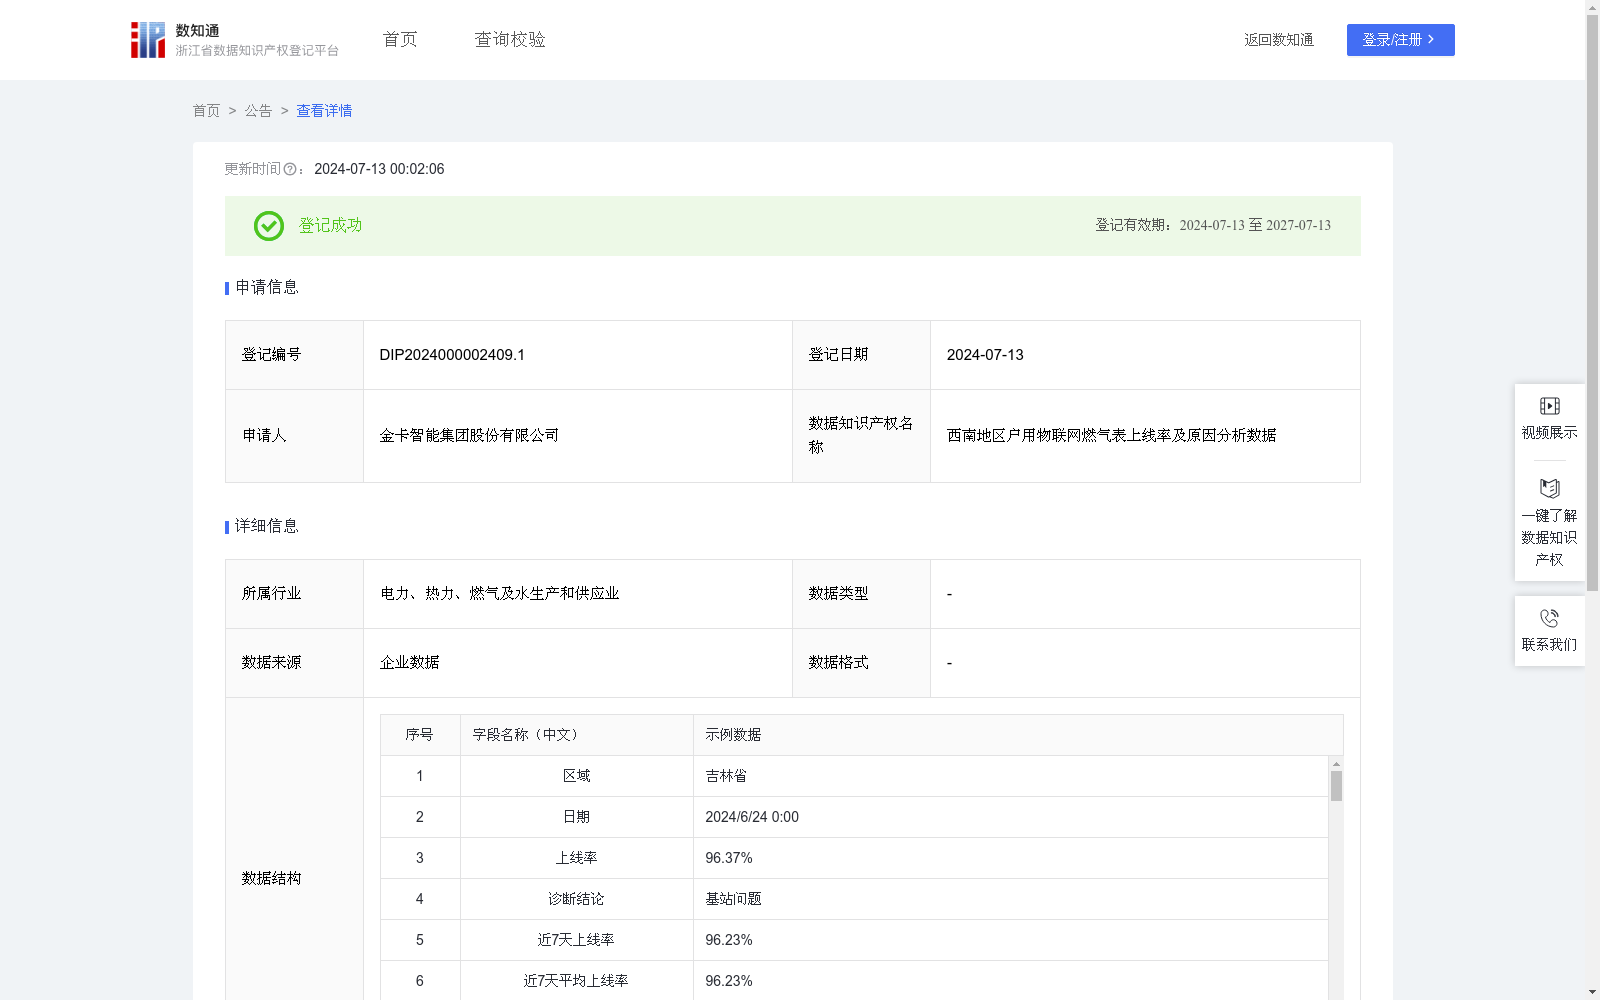
西南地区户用物联网燃气表上线率及原因分析数据
收藏资源简介:
通过燃气表上传的各类数据集,结合燃气公司实际管理特征,计算燃气表真实上线率,结合运营商平台数据,判断表具未上线原因,供燃气公司管理决策。1、获取最新设备编号、区域、上传时间、信号状态、阀门状态、告警状态及近7天上线率等数据; 2、结合燃气公司的管理特征,计算休眠表,例如安装后未启用的表-利用决策树算法,对比历史数据,历史数据特征是安装后1周内会上门通气测试使用;例如通气测试时无法上传数据的表-通过对比历史用气数据,连续2个月均未有气量变化,且已有维修工单,预测其为维修中的表具; 3、计算7日平均上线率计算,7日内有通讯数据的表具/通讯过的设备编号总数 ; 4、结合运营商平台的数据,基站的数据,通过故障树分析,判断链路中断点,设备侧、基站侧、平台侧、系统侧,得出诊断结论; 5、燃气公司根据原因分析展开相应对策,提升其运营效率。
Various datasets uploaded by gas meters, combined with the actual management characteristics of gas companies, are used to calculate the real online rate of gas meters. Combined with operator platform data, the reasons for the offline status of gas meters are identified to support management decision-making of gas companies. 1. Collect data including the latest device ID, region, upload time, signal status, valve status, alarm status, and 7-day online rate and other related metrics; 2. Calculate dormant gas meters based on the management characteristics of gas companies. For example, for meters that have not been activated after installation: use decision tree algorithm to compare with historical data, where the historical data feature is that on-site ventilation testing will be conducted within 1 week after installation. For example, for meters that fail to upload data during ventilation testing: compare historical gas consumption data, predict them as meters under maintenance if there is no gas volume change for 2 consecutive months and a maintenance work order already exists; 3. Calculate the 7-day average online rate, which is the ratio of the number of devices with valid communication data within 7 days to the total number of communicated device IDs; 4. Combined with data from operator platforms and base stations, use fault tree analysis to identify link failure points from the device side, base station side, platform side and system side, and draw corresponding diagnostic conclusions; 5. Gas companies can develop corresponding countermeasures based on the cause analysis to improve their operational efficiency.