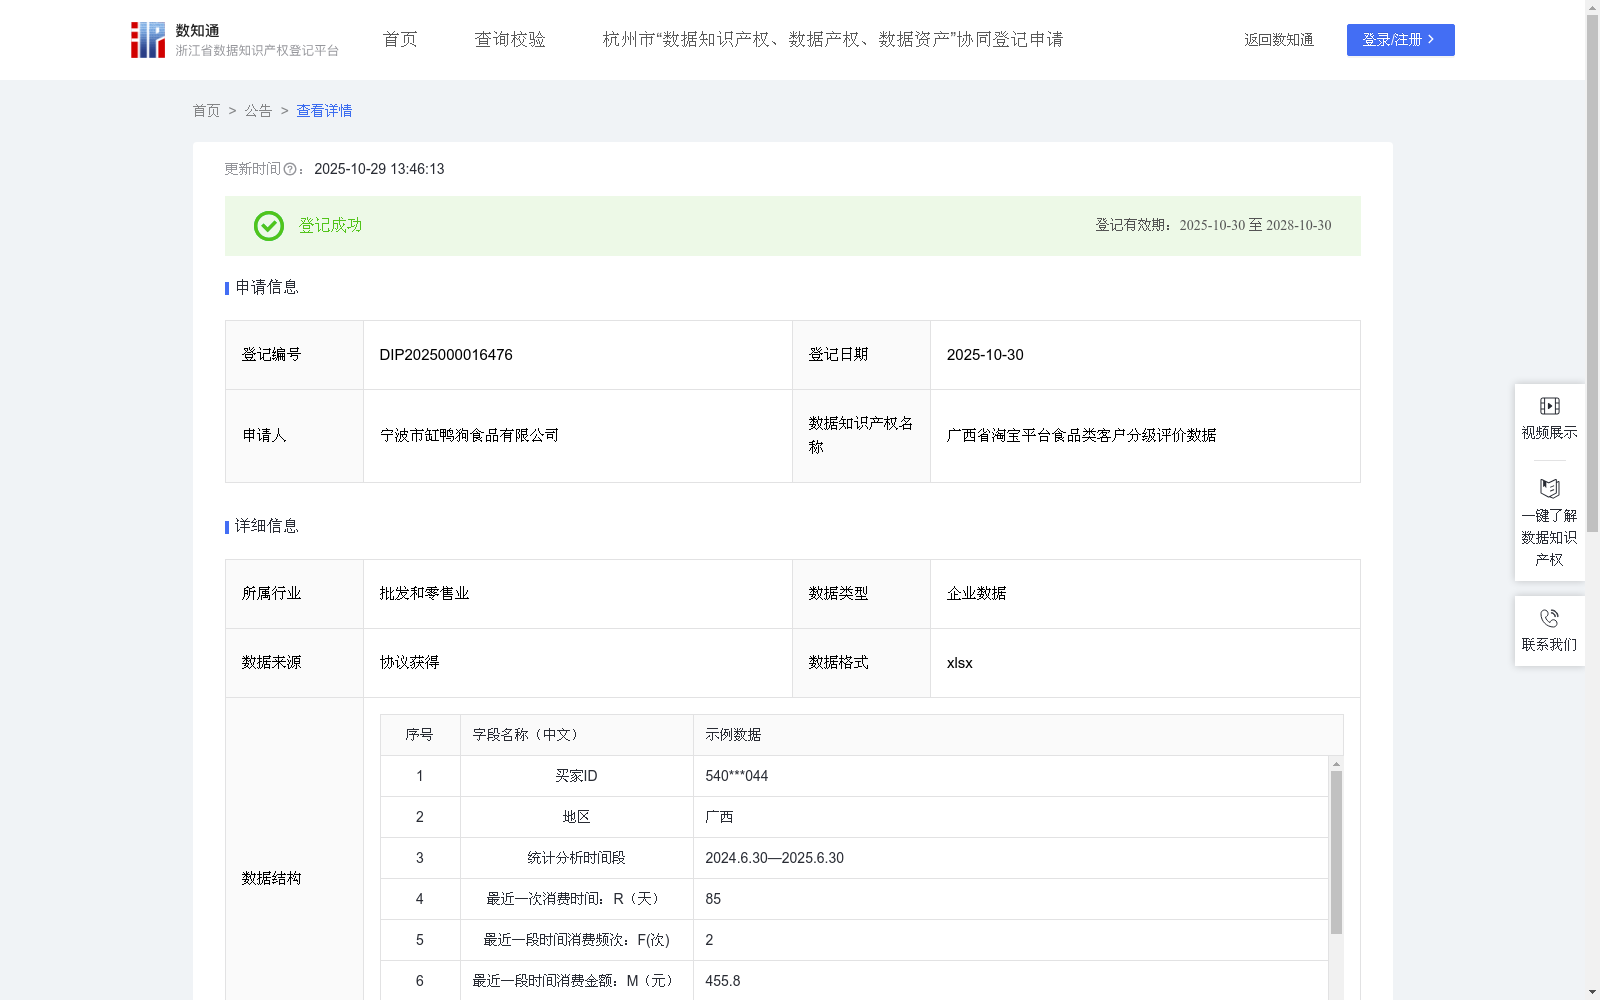
广西省淘宝平台食品类客户分级评价数据
收藏资源简介:
通过对淘宝平台的广西省用户消费行为数据进行深入分析,采用RFM模型来对用户进行细致的价值评级,通过用户的最近一次消费时间(R)、一定时期内的消费频次(F)以及同一时期内的消费金额(M)三个维度,来评估用户的价值和潜在贡献。通过精细化的用户价值管理,为平台的不同价值用户群体提供个性化的服务方案,不仅有助于优化积分和优惠券等激励措施的运营策略,还能为其他营销活动提供坚实的数据支持。具体而言,通过识别出最近消费、消费频次高、消费金额大的高价值用户,并为其提供更加定制化的服务和优惠,对于消费频次较低或消费金额较小的用户,可设计针对性的营销活动,以激发其消费潜力,提升用户活跃度和忠诚度。1、对从销售记录表中采集到对客户的销售单数和销售金额等信息进行脱敏、降噪、清洗、聚集、分析。2、数据加工:运用RFM模型结合客户在统计分析时间段间隔内距离截止日的最近一次消费时间天数(R)、客户在统计分析时间段之间的最近一段时间消费频次(F)和客户在统计分析时间段之间的最近一段时间消费金额(M)的得分排名对客户进行一个综合排名,最终得出一个RFM总评分。a.提取出最近一次消费时间的天数(R)、客户在统计分析时间段之间消费频次(F)和客户在统计分析时间段之间消费金额(M)进行分类,最近一次消费时间间隔最短的客户排在最上面。按照从1-5评分,前20%的客户获得5分,接下来的20%用户获得4分,再下来20%的客户为3分,再下来20% 的客户为2分,最后20% 的客户为1分。 b.根据客户在最近一段时间消费频次(F)从高到底依次对用户进行分类,前20%的客户在用户活动频率的分数为5,以此类推。 c, 根据客户在最近一段时间消费金额(M),前20%的客户在消费金额的分数为5,以此类推。消费金额最少的20%客户则分数为1。 RFM得分=0.3*(R得分)+0.3*(F得分)+0.4*(M得分) 评分大于等于4分的为A级客户,大于等于3小于4的为B级客户,大于等于2小于3的为C 级客户,低于2的为D 级客户。
First, conduct an in-depth analysis of the consumption behavior data of users from Guangxi Province on the Taobao platform, and adopt the RFM model to conduct detailed value grading of users. User value and potential contribution are evaluated based on three dimensions: recency of last consumption (R), consumption frequency within a certain statistical period (F), and total consumption amount during the same period (M). Through refined user value management, providing personalized service solutions for user groups with different value tiers not only helps optimize the operational strategies of incentive measures such as points and coupons, but also provides solid data support for other marketing activities. Specifically, identify high-value users who have made recent purchases, have high purchase frequency and large consumption amounts, and provide them with more customized services and preferential treatments; for users with low purchase frequency or small consumption amounts, design targeted marketing campaigns to stimulate their consumption potential and improve user activity and loyalty. 1. Data preprocessing: Desensitize, denoise, clean, aggregate and analyze information such as the number of sales orders and sales amounts of customers collected from the sales record sheet. 2. Data processing: Use the RFM model combined with the score rankings of three indicators within the statistical analysis period to conduct a comprehensive ranking of customers, and finally obtain the overall RFM score. The three indicators are: the number of days from the customer's last purchase to the deadline of the statistical analysis period (R), the customer's purchase frequency (F) during the statistical analysis period, and the customer's total purchase amount (M) during the statistical analysis period. a. For the recency indicator (R): Classify customers based on the interval since their last purchase, with customers having the shortest interval ranked first. Assign scores from 1 to 5: the top 20% of customers receive 5 points, the subsequent 20% get 4 points, the following 20% get 3 points, the next 20% get 2 points, and the last 20% get 1 point. b. For the purchase frequency indicator (F): Sort customers in descending order of their purchase frequency during the statistical analysis period. The top 20% of customers get 5 points for their activity frequency, and the remaining customers are assigned scores in the same 20% tiered manner. c. For the purchase amount indicator (M): Sort customers in descending order of their total purchase amount during the statistical analysis period. The top 20% of customers get 5 points, and the bottom 20% with the smallest purchase amount get 1 point, with the other tiers assigned scores proportionally. The comprehensive RFM score is calculated as: RFM Score = 0.3*(R score) + 0.3*(F score) + 0.4*(M score). Customers are categorized into four tiers based on their comprehensive RFM score: Grade A customers (score ≥ 4), Grade B customers (3 ≤ score < 4), Grade C customers (2 ≤ score < 3), and Grade D customers (score < 2).