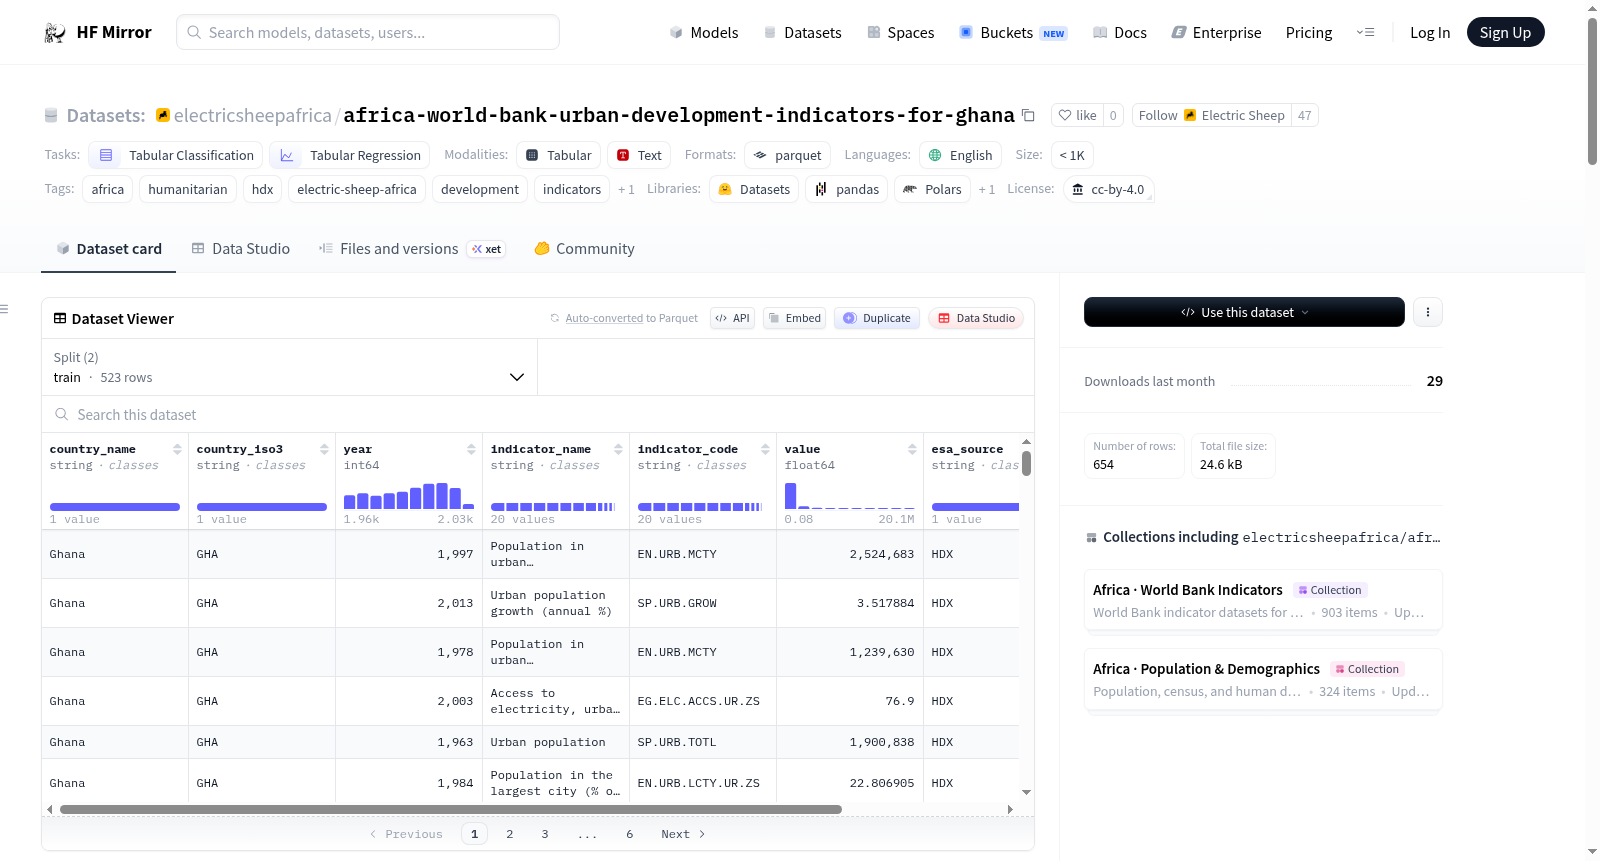
electricsheepafrica/africa-world-bank-urban-development-indicators-for-ghana
收藏Hugging Face2026-04-10 更新2026-04-12 收录
下载链接:
https://hf-mirror.com/datasets/electricsheepafrica/africa-world-bank-urban-development-indicators-for-ghana
下载链接
链接失效反馈官方服务:
资源简介:
---
annotations_creators:
- no-annotation
language_creators:
- found
language:
- en
license: cc-by-4.0
multilinguality:
- monolingual
size_categories:
- n<1K
source_datasets:
- original
task_categories:
- tabular-classification
- tabular-regression
task_ids: []
tags:
- africa
- humanitarian
- hdx
- electric-sheep-africa
- development
- indicators
- gha
pretty_name: "Ghana - Urban Development"
dataset_info:
splits:
- name: train
num_examples: 523
- name: test
num_examples: 130
---
# Ghana - Urban Development
**Publisher:** World Bank Group · **Source:** [HDX](https://data.humdata.org/dataset/world-bank-urban-development-indicators-for-ghana) · **License:** `cc-by` · **Updated:** 2026-03-27
---
## Abstract
Contains data from the World Bank's [data portal](http://data.worldbank.org/). There is also a [consolidated country dataset](https://data.humdata.org/dataset/world-bank-combined-indicators-for-ghana) on HDX.
Cities can be tremendously efficient. It is easier to provide water and sanitation to people living closer together, while access to health, education, and other social and cultural services is also much more readily available. However, as cities grow, the cost of meeting basic needs increases, as does the strain on the environment and natural resources. Data on urbanization, traffic and congestion, and air pollution are from the United Nations Population Division, World Health Organization, International Road Federation, World Resources Institute, and other sources.
Each row in this dataset represents country-level aggregates. Data was last updated on HDX on 2026-03-27. Geographic scope: **GHA**.
*Curated into ML-ready Parquet format by [Electric Sheep Africa](https://huggingface.co/electricsheepafrica).*
---
## Dataset Characteristics
| | |
|---|---|
| **Domain** | Public health |
| **Unit of observation** | Country-level aggregates |
| **Rows (total)** | 654 |
| **Columns** | 8 (2 numeric, 6 categorical, 0 datetime) |
| **Train split** | 523 rows |
| **Test split** | 130 rows |
| **Geographic scope** | GHA |
| **Publisher** | World Bank Group |
| **HDX last updated** | 2026-03-27 |
---
## Variables
**Geographic** — `country_name` (Ghana), `country_iso3` (GHA), `year` (range 1960.0–2025.0).
**Outcome / Measurement** — `value` (range 0.0754–20093728.0).
**Identifier / Metadata** — `indicator_name` (Population in the largest city (% of urban population), Population in largest city, Population in urban agglomerations of more than 1 million), `indicator_code` (EN.URB.LCTY.UR.ZS, EN.URB.LCTY, EN.URB.MCTY), `esa_source` (HDX), `esa_processed` (2026-04-10).
---
## Quick Start
```python
from datasets import load_dataset
ds = load_dataset("electricsheepafrica/africa-world-bank-urban-development-indicators-for-ghana")
train = ds["train"].to_pandas()
test = ds["test"].to_pandas()
print(train.shape)
train.head()
```
---
## Schema
| Column | Type | Null % | Range / Sample Values |
|---|---|---|---|
| `country_name` | object | 0.0% | Ghana |
| `country_iso3` | object | 0.0% | GHA |
| `year` | int64 | 0.0% | 1960.0 – 2025.0 (mean 1995.3135) |
| `indicator_name` | object | 0.0% | Population in the largest city (% of urban population), Population in largest city, Population in urban agglomerations of more than 1 million |
| `indicator_code` | object | 0.0% | EN.URB.LCTY.UR.ZS, EN.URB.LCTY, EN.URB.MCTY |
| `value` | float64 | 0.0% | 0.0754 – 20093728.0 (mean 1215062.6552) |
| `esa_source` | object | 0.0% | HDX |
| `esa_processed` | object | 0.0% | 2026-04-10 |
---
## Numeric Summary
| Column | Min | Max | Mean | Median |
|---|---|---|---|---|
| `year` | 1960.0 | 2025.0 | 1995.3135 | 1998.0 |
| `value` | 0.0754 | 20093728.0 | 1215062.6552 | 51.0255 |
---
## Curation
Raw data was downloaded from HDX via the CKAN API and converted to Parquet. Column names were lowercased and standardised to snake_case. Common missing-value markers (`N/A`, `null`, `none`, `-`, `unknown`, `no data`, `#N/A`) were unified to `NaN`. The dataset was split 80/20 into train and test partitions using a fixed random seed (42) and saved as Snappy-compressed Parquet.
---
## Limitations
- Data originates from World Bank Group and has not been independently validated by ESA.
- Automated cleaning cannot correct for misreported values, definitional inconsistencies, or sampling bias in the original collection.
- Refer to the [original HDX dataset page](https://data.humdata.org/dataset/world-bank-urban-development-indicators-for-ghana) for the publisher's own methodology notes and caveats.
---
## Citation
```bibtex
@dataset{hdx_africa_world_bank_urban_development_indicators_for_ghana,
title = {Ghana - Urban Development},
author = {World Bank Group},
year = {2026},
url = {https://data.humdata.org/dataset/world-bank-urban-development-indicators-for-ghana},
note = {Repackaged for machine learning by Electric Sheep Africa (https://huggingface.co/electricsheepafrica)}
}
```
---
*[Electric Sheep Africa](https://huggingface.co/electricsheepafrica) — Africa's ML dataset infrastructure. Lagos, Nigeria.*
提供机构:
electricsheepafrica
搜集汇总
数据集介绍
构建方式
在城市化研究领域,数据集的构建往往依赖于权威机构的长期观测与整合。本数据集源自世界银行集团的数据门户,由Electric Sheep Africa团队从人道主义数据交换平台获取原始资料,并通过自动化流程进行标准化处理。原始数据经由CKAN API下载后,经历了列名规范化与缺失值统一等清洗步骤,最终转换为Parquet格式并按照80/20的比例划分为训练集与测试集,确保了数据在机器学习任务中的即用性。
特点
该数据集聚焦于加纳的城市发展指标,涵盖了从1960年至2025年的国家层面聚合数据。其核心特征在于以简洁的表格结构呈现关键城市化度量,包括最大城市人口占比、最大城市人口数量以及百万以上城市群人口等三类指标。数据集规模适中,包含654条观测记录和8个特征变量,兼具数值型与分类型数据,为研究城市效率、资源分配及环境压力等议题提供了跨时序的量化基础。
使用方法
对于希望利用该数据集的研究者,可通过Hugging Face的datasets库直接加载,快速获取已分割的训练集与测试集。加载后的数据可方便地转换为Pandas DataFrame进行探索性分析或建模。鉴于其结构化特征,该数据集适用于表格分类或回归任务,能够支持城市发展模式的预测分析、指标关联性研究,或作为跨国比较研究中的区域案例。
背景与挑战
背景概述
城市化进程作为全球发展的重要驱动力,其监测与评估对于政策制定具有深远意义。世界银行集团于2026年发布了加纳城市发展指标数据集,该数据集由Electric Sheep Africa机构进行机器学习友好化处理,旨在提供加纳国家层面的城市化动态数据。核心研究问题聚焦于量化城市人口分布、大型城市集聚程度等关键指标,以支持公共卫生、资源分配及可持续发展领域的实证分析。该数据集整合了联合国人口司、世界卫生组织等多源数据,为研究非洲城市化模式及其社会经济影响提供了标准化基准。
当前挑战
该数据集致力于解决城市发展指标的可计算化表征挑战,即如何将复杂的城市化现象转化为结构化、可建模的数值特征,以支持回归或分类任务。在构建过程中,面临原始数据异构性整合的困难,包括不同国际机构指标定义的一致性协调、历史数据缺失值的规范化处理,以及跨年份时间序列的完整性保障。此外,自动化清洗流程难以修正源数据中可能存在的报告偏差或方法论差异,这要求使用者深入理解世界银行原始收集方法的内在局限。
常用场景
经典使用场景
在城市化研究领域,该数据集为分析加纳城市发展动态提供了关键时序数据。研究者通常利用其包含的1960年至2025年间的城市人口分布指标,如最大城市人口占比、百万以上城市群人口等,构建回归模型以揭示城市化进程中的长期趋势与周期性波动。这些指标能够直观反映城市首位度变化,为理解城市体系演变提供量化依据。
实际应用
在实际政策制定层面,该数据集被加纳政府机构用于城市基础设施规划与公共卫生资源配置。城市规划者依据最大城市人口占比数据评估区域发展均衡性,卫生部门则结合城市人口密度指标优化医疗设施布局。国际组织亦利用这些指标监测撒哈拉以南非洲地区的城市化进程,支持区域发展项目的效果评估。
衍生相关工作
基于该数据集衍生的经典研究包括世界银行发布的《非洲城市转型报告》,其中运用加纳案例验证城市集聚经济效益模型。学术界则产生了多项关于西非城市首位度演变的比较研究,如将加纳数据与科特迪瓦指标进行对比分析。机器学习领域亦有工作利用该数据集训练城市人口预测模型,为智慧城市研究提供基准测试框架。
以上内容由遇见数据集搜集并总结生成


