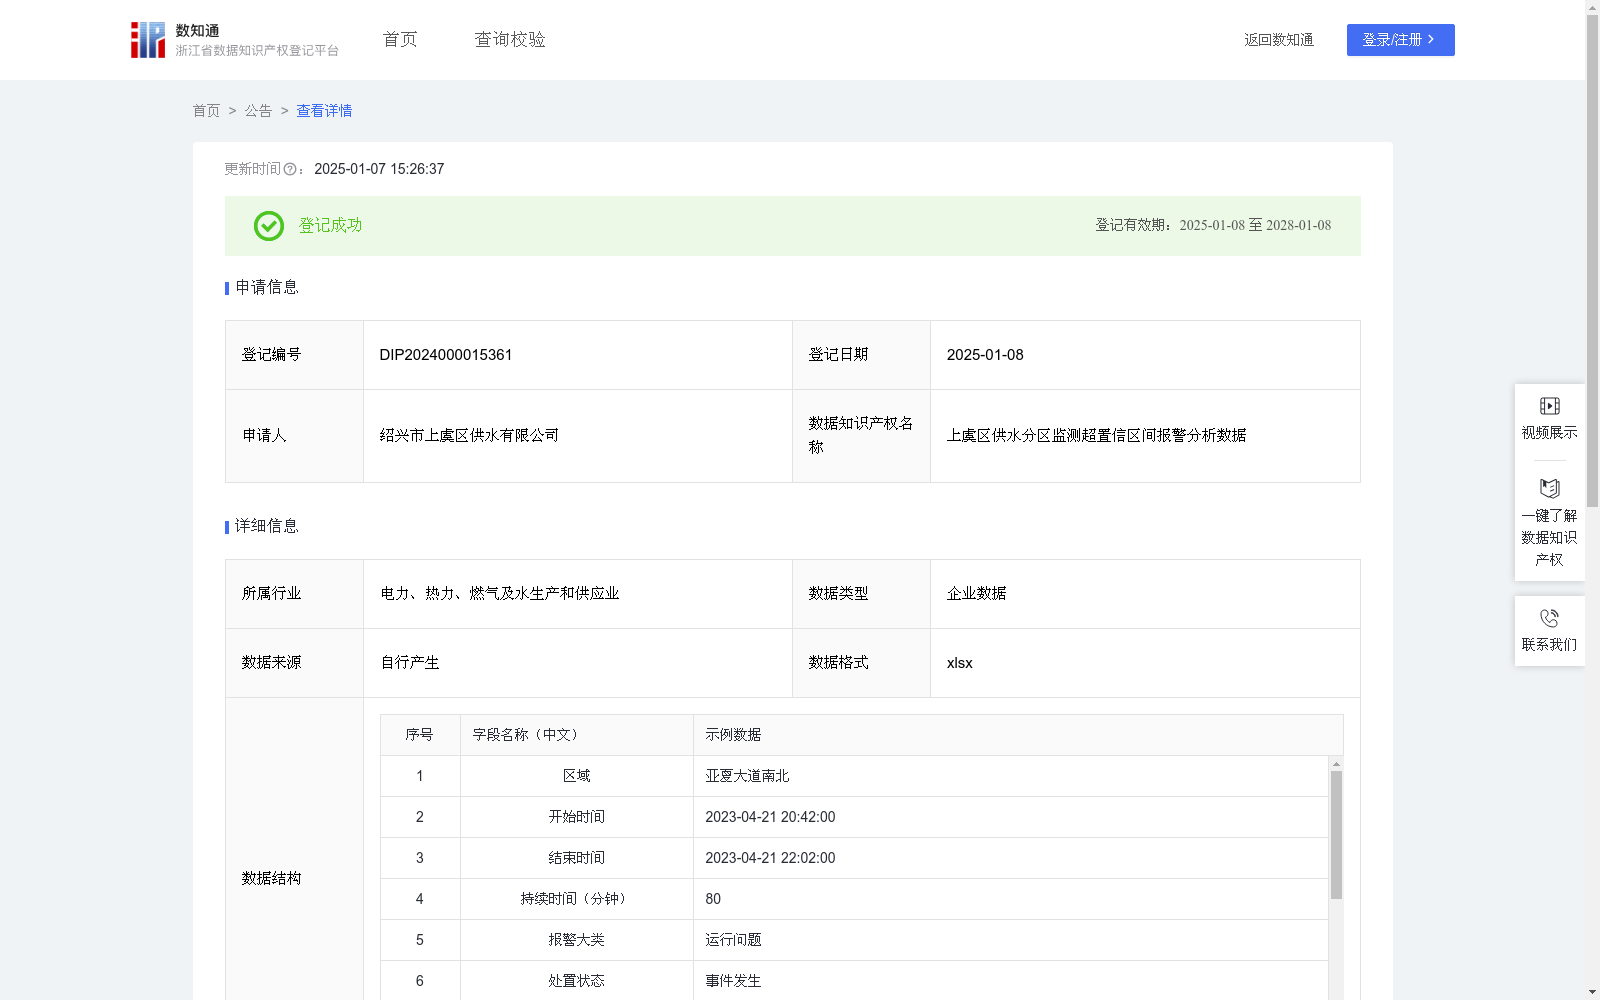
上虞区供水分区监测超置信区间报警分析数据
收藏浙江省数据知识产权登记平台2025-01-07 更新2025-01-08 收录
下载链接:
https://www.zjip.org.cn/home/announce/trends/110533
下载链接
链接失效反馈官方服务:
资源简介:
1.本公司可以根据监测的分区监测超置信区间数据合理安排供水量生产水阀门状态;可以更好地识别水管运行风险,比如由导致的生产过剩导致的有规律性报警。 2.本数据可以共享给本公司服务的上游供应商或生态伙伴(如物业、市政管理、外包运维等),帮助其调整巡检计划,以更好、更快地处理突发问题完成任务,排查所属地区水管网络故障对社会经济及居民生活的影响。 3.本数据可供相应的水管或与本产品相配套的流量计厂商,为研发、生产等经营活动决策提供辅助依据。 数据采集:实时采集超限报警的区域、时间、类别、等级、监测数据及描述信息。
算法加工:置信区间计算。首先提取过去30天的历史数据,并对其进行初步的数据清洗,删除缺失或明显错误的数据点。接着,对全天同一时刻的数据进行异常值检测,利用四分位数(Q1和Q3)和四分位距(IQR)来确定数据的正常范围,并将超出此范围的数据视为异常值并删除。在删除了异常值后,计算全天每个时刻数据的最大值和最小值,作为初步置信区间的上下限,并进行平滑处理以减少波动。随后,通过迭代调整的方法进一步优化置信区间,并在其基础上向上平移上限和向下平移下限,加入了等于置信区间宽度安全余量。最终,得到经过清洗、处理和调整后的监测数据及其置信区间,删除了置信区间外的所有数据点,为后续的监测和分析提供了可靠的数据基础。
报警等级的计算依据监测数据与置信区间的关系而定。当监测数据处于置信区间内部时,视为正常,不触发报警;若数据超出置信区间上限,则计算其与上限的差值占置信区间宽度的倍数,并向上取整作为报警等级;同样,当数据低于置信区间下限时,计算下限与数据的差值占区间宽度的倍数,并向上取整来确定报警等级。报警等级的高低直接反映了监测数据偏离正常范围的幅度。
针对每个等级,系统会提供可能的报警原因供参考。随后,工作人员会审核并确认这些报警信息,采取相应的处置措施,并记录处置的状态。当监测数据重新回归到合理范围内时,系统会结束报警,并记录报警结束的时间。
1. Our company can reasonably arrange water supply volumes and adjust water valve operating statuses based on zone-monitored out-of-confidence-interval data, and better identify water pipe operation risks, such as regular alarms caused by overproduction. 2. This data can be shared with upstream suppliers or ecological partners served by our company (such as property management entities, municipal authorities, outsourced operation and maintenance teams, etc.), to help them adjust their inspection patrol plans, handle emergencies more efficiently to complete tasks, and assess the impact of water pipe network faults in their respective regions on social economy and residents' daily lives. 3. This data can be provided to corresponding water pipe manufacturers or flowmeter manufacturers supporting our products, to provide auxiliary support for decision-making in business activities such as R&D and production.
Data Collection: Collect the region, time, category, level, monitoring data and description information of out-of-limit alarms in real time.
Algorithm Processing: Confidence interval calculation. First, extract the historical data of the past 30 days and conduct preliminary data cleaning, deleting missing or obviously erroneous data points. Next, perform outlier detection on data collected at the same time across the entire day, using quartiles (Q1 and Q3) and interquartile range (IQR) to define the normal data range, and remove data points exceeding this range as outliers. After removing outliers, calculate the maximum and minimum values of data at each time of the day as the upper and lower bounds of the preliminary confidence interval, and apply smoothing processing to reduce fluctuations. Subsequently, further optimize the confidence interval via iterative adjustment, then shift the upper limit upward and the lower limit downward based on the optimized interval, adding a safety margin equal to the width of the confidence interval. Finally, obtain the cleaned, processed and adjusted monitoring data and their corresponding confidence intervals, and delete all data points outside the confidence interval, thereby providing a reliable data foundation for subsequent monitoring and analysis.
Alarm Level Calculation: The alarm level is determined based on the relationship between the monitoring data and the confidence interval. When the monitoring data falls within the confidence interval, it is deemed normal and no alarm is triggered. If the data exceeds the upper limit of the confidence interval, calculate the multiple of the difference between the data and the upper limit relative to the width of the confidence interval, then round up the result to obtain the alarm level. Similarly, when the data is lower than the lower limit of the confidence interval, calculate the multiple of the difference between the lower limit and the data relative to the interval width, then round up to determine the alarm level. The alarm level directly reflects the degree to which the monitoring data deviates from the normal range.
For each alarm level, the system will provide reference for possible alarm causes. Subsequently, staff will review and confirm these alarm messages, take corresponding disposal measures, and record the disposal status. When the monitoring data returns to a reasonable range, the system will terminate the alarm and record the alarm end time.
提供机构:
绍兴市上虞区供水有限公司
创建时间:
2024-11-12
搜集汇总
数据集介绍
特点
该数据集包含上虞区供水分区监测超置信区间的报警数据,用于供水生产调度和风险识别,数据规模为2655条,按需更新。
以上内容由遇见数据集搜集并总结生成


