
lia-prop13/startup-Investments-analysis
收藏Hugging Face2026-04-10 更新2026-04-12 收录
下载链接:
https://hf-mirror.com/datasets/lia-prop13/startup-Investments-analysis
下载链接
链接失效反馈官方服务:
资源简介:
---
license: mit
task_categories:
- tabular-classification
size_categories:
- 1K<n<10K
tags:
- datasets
- pandas
- startup-analysis
- eda
- venture-capital
- finance
- entrepreneurship
- crunchbase
- acquisitions
- investment-trends
- data-science
- business-intelligence
- startup-survival
configs:
- config_name: default
data_files:
- split: train
path: "data.csv"
dataset_info:
features:
- name: market
dtype: string
- name: country_code
dtype: string
- name: founded_year
dtype: int64
- name: funding_total_usd
dtype: float64
- name: funding_rounds
dtype: int64
- name: unclassified_funding
dtype: float64
- name: seed
dtype: float64
- name: angel
dtype: float64
- name: equity_crowdfunding
dtype: float64
- name: convertible_note
dtype: float64
- name: debt_financing
dtype: float64
- name: grant
dtype: float64
- name: private_equity
dtype: float64
- name: product_crowdfunding
dtype: float64
- name: round_A
dtype: float64
- name: round_B
dtype: float64
- name: round_C
dtype: float64
- name: round_D
dtype: float64
- name: round_E
dtype: float64
- name: round_F
dtype: float64
- name: round_G
dtype: float64
- name: round_H
dtype: float64
- name: status
dtype: int64
---
# **📊 StartUp Investments EDA**
<video src="https://huggingface.co/datasets/lia-prop13/startup-Investments-analysis/resolve/main/Presentation_video.mp4" controls="controls" style="max-width: 400px;"></video>
---
## **1. Background & Objectives**
This project explores a comprehensive dataset of startup investments (sourced from Crunchbase) to uncover the primary factors that predict a startup's survival and trajectory in a competitive market.
Through this Exploratory Data Analysis (EDA), we analyze historical funding data, investment rounds, and market categories to determine which variables drive specific company outcomes - namely, whether a business is ultimately "closed" or "acquired". In the context of this research, an acquisition serves as the most definitive indicator that a startup has survived and generated sufficient market value to be purchased and continue its operations.
---
## **2. Research Question**
Based on historical investment data, what are the strongest predictors of a startup being acquired (an exit)?
- Rationale: By utilizing investment data to predict acquisitions, this analysis aims to identify the core indicators of startup survival. In this context, an acquisition serves as a strategic proxy: it signifies that a startup has generated sufficient market value and institutional validation to avoid collapse in a volatile environment.
---
## **3. Dataset Overview**
**Dataset Characteristics**
The dataset provides a comprehensive look into the global startup ecosystem, utilizing data from Crunchbase—the premier platform for tracking private companies and investment trends. It encompasses extensive financial metrics, ranging from specific investment amounts across various rounds to debt and grants, alongside critical operational details such as market categories and company status. This specific version was sourced from Kaggle to analyze the factors driving startup survival and acquisition.
- **Source:** [Access Raw Dataset Here](https://www.kaggle.com/datasets/arindam235/startup-investments-crunchbase)
- **Raw size:** Approximately 54,000 rows & 39 features
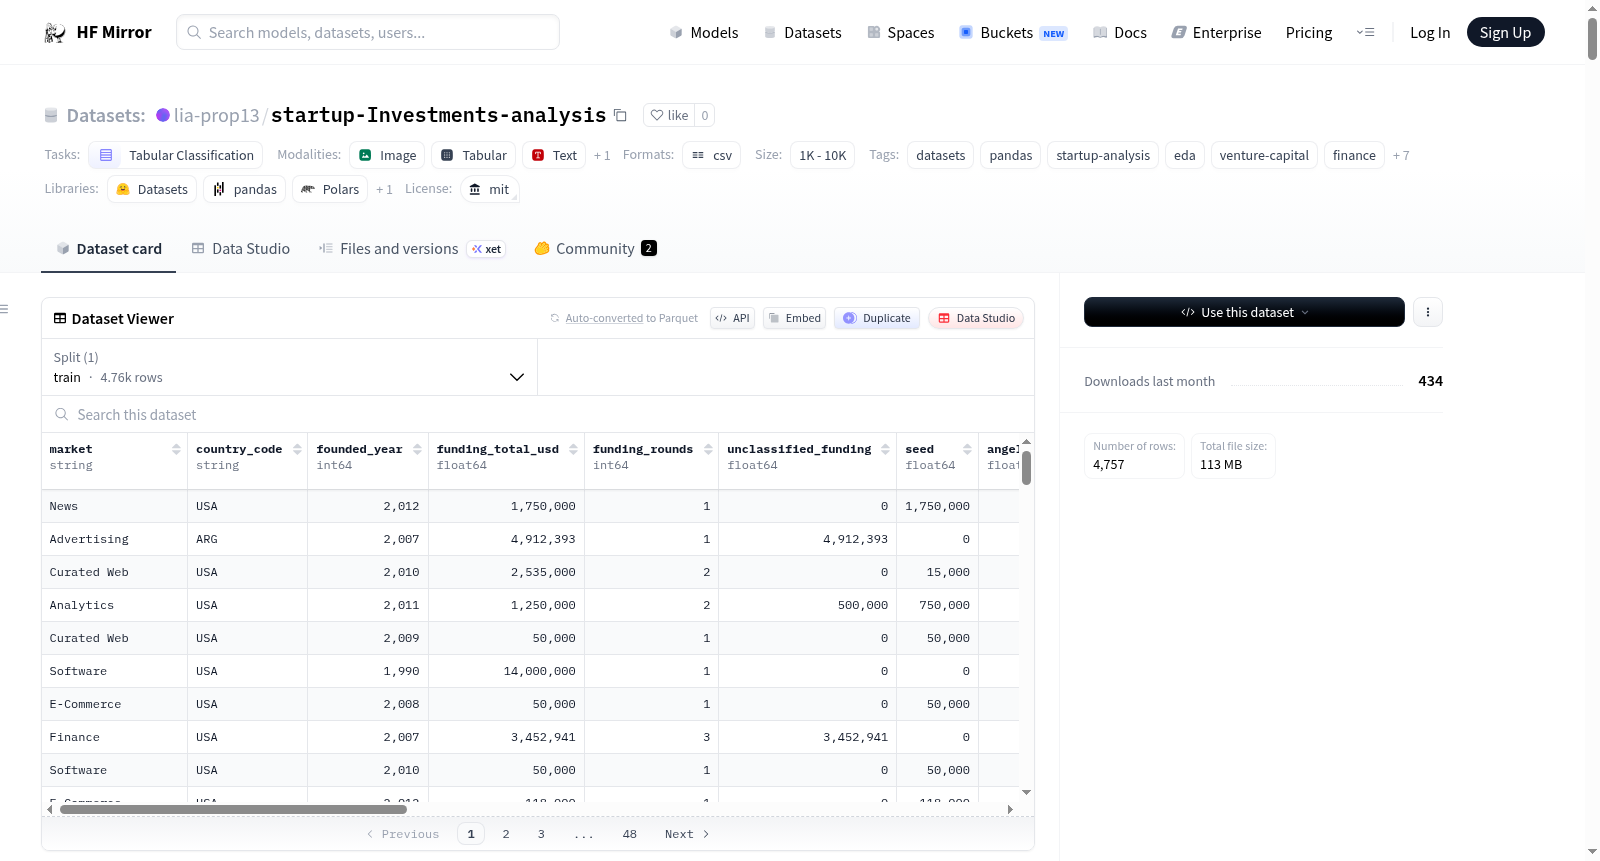
- **Clean size:** 4,757 rows & 23 features
**Target Variable and Sampling Strategy**
The primary target for prediction is the company status, which has been transformed into a numeric binary format: **1 (Acquired)** and **0 (Closed)**.
To ensure a clear and definitive predictive outcome, the dataset was strategically sampled by removing all "operating" records. This decision was driven by the inherent ambiguity of currently operating startups, which could either be on a path to success or on the verge of collapse. By focusing exclusively on finalized exit events (Acquisitions vs. Closures), we eliminate potential target leakage and establish a robust, balanced dataset of approximately 6,300 records for analysis.
- **Class Distribution:** The sampling process resulted in a relatively balanced distribution between the two target outcomes: 62% Acquired and 38% Closed. This ratio provides a reliable basis for analysis, ensuring that both categories are sufficiently represented to identify the key predictors of startup success versus closure.
**Data Dictionary**
The following table outlines the 23 features included in the final cleaned dataset, categorized by their role in the analysis:
| Feature(s) | Category | Description |
| :--- | :--- | :--- |
| `status` | **Target** | The prediction goal: **1 for Acquired, 0 for Closed.** |
| `market`, `country_code`, `founded_year` | **Core Attributes** | Descriptive indicators of the startup's industry, geography, and age. |
| `funding_total_usd`, `funding_rounds` | **Financial Aggregates** | Global metrics of total capital raised and the frequency of investment events. |
| `round_A` through `round_H` | **Investment Stages** | Capital raised specifically in each professional venture round. |
| `seed`, `angel`, `equity_crowdfunding`, `product_crowdfunding` | **Early & Alternative** | Early-stage funding sources often indicating initial market validation. |
| `debt_financing`, `grant`, `private_equity`, `convertible_note`, `unclassified_funding` | **Specialized Funding** | Various financial instruments used to sustain operations or drive growth. |
---
## **4. Data Preprocessing & Cleaning**
**Initial Data Assessment**
A diagnostic review of the raw dataset was performed to identify potential integrity issues and noise. The assessment revealed several critical areas requiring attention:
- **Redundancy:** Identification of 4,855 duplicate records within the raw data.
- **Missing Value Density:** Significant gaps identified in geographical features (e.g., state_code with >24k missing values) and founding dates.
- **Data Gaps:** A recurring pattern of missing information across approximately 4,856 financial records, indicating low-signal data points that could impact model reliability.
**I. Structural Cleaning & Feature Selection**
- **Deduplication:** Removed 4,855 duplicates to ensure unique entity representation.
- (49,439 rows remain)
- **Target Refinement:** Isolated finalized outcomes (Acquired/Closed) by removing "Operating" and null records; prevents target leakage and ambiguity.
- (6,295 rows remain)
- **Dimensionality Reduction:** Dropped 16 irrelevant columns, narrowing the focus to **23 high-impact features**.
<details>
<summary><b>Click to view the Feature Removal Log & Rationale</b></summary>
To streamline the predictive model and eliminate noise, the following features were removed:
* **Identifiers & Web:** `name`, `homepage_url`, `permalink` (Zero predictive signal).
* **Granular Location:** `city`, `region`, `state_code` (Removed to prevent overfitting; `country_code` retained for generalizability).
* **Temporal Noise:** Exact dates and months (e.g., `founded_at`, `founded_month`) removed to reduce noise; `founded_year` kept as a stable predictor.
* **Out-of-Scope Financials:** `post_ipo_equity`, `post_ipo_debt`, `secondary_market` (Public/late-stage metrics outside research scope).
* **Ambiguous Data:** `undisclosed` (Missing or hidden funding provides no actionable profile).
* **Redundancy:** `category_list` (Streamlined in favor of the cleaner `market` feature).
</details>
**II. Handling Missing Values (Imputation & Filtering)**
- **Temporal Data:** Imputed founded_year (21.1% missing) using the median. This preserves data volume while providing a stable estimate for age-based calculations without introducing significant distribution bias.
- **Identity Integrity:** Removed records with missing market (3.67%) or country_code (9.98%). Since these features are core identity markers, imputing them would introduce synthetic noise and reduce the model's real-world reliability.
- (5,499 rows remain)
**III. Data Integrity Audit & Formatting**
While the dataset was technically free of nulls, a deep-dive audit was conducted to ensure **internal logical consistency** between reported funding rounds and actual financial data.
- **Financial Reconciliation Audit:** We identified a significant mismatch (3,064 records) where the stated `funding_rounds` did not align with the number of categorized financial columns.
<details>
<summary><b>Click to view the 4-Stage Forensic Audit & Reconciliation</b></summary>
To achieve 100% logical consistency, the following logic was applied:
1. **Identifying Redundant Aggregates:** The `venture` column was identified as a "noisy aggregate" that double-counted specific rounds (e.g., Series A/B). Removing it reduced logical mismatches to 1,792.
2. **Financial Reconstruction:** To preserve data while eliminating noise, we used `funding_total_usd` as a "truth anchor" and engineered a new feature:
`Unclassified_Funding = Total_Funding - Σ(Categorized_Rounds)`
This isolated grouped or undisclosed investments that were previously hidden within the venture aggregate.
3. **Isolating "Financial Ghosts":** Post-reconstruction, the remaining 658 mismatches were identified as records with 0 total funding - essentially missing data disguised as zeros.
4. **Strategic Cleansing & Justification:** These 658 records were permanently removed. **Rationale:** Since venture capital distributions are highly non-normal (skewed), imputing these values would introduce significant bias and distort the relationship between interconnected financial features.
**Final Outcome:** Achieved **100% logical consistency** across a high-fidelity dataset of **4,841 records**.
</details>
- **Data Sanitation & Normalization:** Standardized data types for numerical features and sanitized categorical strings by removing hidden whitespaces and special characters.
- **Logical Schema Reordering:** Reorganized the dataset structure for improved interpretability: Metadata (Market/Geography) → Global Financial Metrics → Detailed Funding Rounds → Target Status.
**IV. Outlier Treatment & Visual Justification**
The final stage of data preparation involved addressing extreme values to ensure model robustness. This process was guided by visual diagnostics to distinguish between statistical noise and critical industry signals.
- **Temporal Filtering (1990 Cutoff):** <br>
<img src=https://huggingface.co/datasets/lia-prop13/startup-Investments-analysis/resolve/main/outliers_analysis2.png width="45%">
<br>
- **Observation:** The box plot of `founded_year` revealed a significant "left tail" of legacy companies founded as far back as the early 20th century.
- **Action:** Removed records prior to 1990 (approx. 1.7% of the dataset / 84 rows).
- **Rationale:** This ensures the analysis remains representative of the modern venture capital and tech landscape, reducing temporal noise that does not reflect current market dynamics.
- **Preserving Strategic Extremes (Financial Outliers):** <br>
<div style="display: flex; align-items: flex-start; gap: 10px;">
<img src=https://huggingface.co/datasets/lia-prop13/startup-Investments-analysis/resolve/main/outliers_analysis1.png width="45%" />
<img src=https://huggingface.co/datasets/lia-prop13/startup-Investments-analysis/resolve/main/outliers_analysis3.png width="45%" />
</div>
<br>
- **Observation:** Extreme outliers were identified in `funding_total_usd` and `funding_rounds`, creating a massive positive skew (Right Tail).
- **Action:** These records were intentionally retained.
- **Rationale:** In the startup ecosystem, extreme success—such as "Unicorns" or serial fundraises—follows a **Power Law** distribution. These are not data errors; they are the most critical signals for predicting high-growth outcomes. Removing them would strip the model of its ability to identify the very entities we aim to analyze.
---
## **5. Descriptive Statistics**
Following the data preparation and outlier treatment, this section provides a high-level quantitative and qualitative overview of the finalized dataset (4,841 records).
**Numerical Summary (Transposed):**
| | count | mean | median | std | min | 25% | 50% | 75% | max |
|:---------------------|--------:|-----------------:|---------:|-----------------:|------:|---------:|---------:|--------------:|---------------:|
| founded_year | 4757 | 2005.9 | 2007 | 4.09 | 1990 | 2004 | 2007 | 2009 | 2014 |
| funding_total_usd | 4757 | 1.83434e+07 | 5e+06 | 9.81919e+07 | 1000 | 1e+06 | 5e+06 | 1.64e+07 | 5.7e+09 |
| funding_rounds | 4757 | 1.95 | 1 | 1.35 | 1 | 1 | 1 | 2 | 15 |
| unclassified_funding | 4757 | 4.61351e+06 | 0 | 8.27854e+07 | 0 | 0 | 0 | 1.5074e+06 | 5.62e+09 |
| seed | 4757 | 193416 | 0 | 763443 | 0 | 0 | 0 | 0 | 2.5e+07 |
| angel | 4757 | 86483 | 0 | 645952 | 0 | 0 | 0 | 0 | 3e+07 |
| equity_crowdfunding | 4757 | 1671.22 | 0 | 87001.3 | 0 | 0 | 0 | 0 | 5.5e+06 |
| convertible_note | 4757 | 10229.8 | 0 | 231873 | 0 | 0 | 0 | 0 | 1.35201e+07 |
| debt_financing | 4757 | 1.55338e+06 | 0 | 2.52692e+07 | 0 | 0 | 0 | 0 | 1.2e+09 |
| grant | 4757 | 37656.4 | 0 | 1.5033e+06 | 0 | 0 | 0 | 0 | 9.98e+07 |
| private_equity | 4757 | 2.16958e+06 | 0 | 2.4383e+07 | 0 | 0 | 0 | 0 | 7.71e+08 |
| product_crowdfunding | 4757 | 567.58 | 0 | 35067.1 | 0 | 0 | 0 | 0 | 2.4e+06 |
| round_A | 4757 | 2.11219e+06 | 0 | 7.06771e+06 | 0 | 0 | 0 | 2e+06 | 2.25e+08 |
| round_B | 4757 | 3.11991e+06 | 0 | 9.92575e+06 | 0 | 0 | 0 | 0 | 3.5e+08 |
| round_C | 4757 | 2.37028e+06 | 0 | 8.63402e+06 | 0 | 0 | 0 | 0 | 2e+08 |
| round_D | 4757 | 1.32201e+06 | 0 | 8.84972e+06 | 0 | 0 | 0 | 0 | 2.5e+08 |
| round_E | 4757 | 514288 | 0 | 5.24311e+06 | 0 | 0 | 0 | 0 | 2.2e+08 |
| round_F | 4757 | 209741 | 0 | 4.98233e+06 | 0 | 0 | 0 | 0 | 2.86e+08 |
| round_G | 4757 | 28484.3 | 0 | 1.1888e+06 | 0 | 0 | 0 | 0 | 6.3e+07 |
| round_H | 4757 | 0 | 0 | 0 | 0 | 0 | 0 | 0 | 0 |
| status | 4757 | 0.62 | 1 | 0.49 | 0 | 0 | 1 | 1 | 1 |
**Categorical Overview:**
| | count | unique | top | freq |
|:-------------|--------:|---------:|:---------|-------:|
| market | 4757 | 377 | Software | 599 |
| country_code | 4757 | 61 | USA | 3618 |
**Key Statistical Insights:**
- **Distributional Skewness:** The significant gap between the Mean ($18.3M) and the Median ($5M) in total funding confirms a heavy right-skew. This reflects the "Power Law" of the venture capital world, where a few high-value entities significantly influence the overall financial volume.
- **Funding Feature Sparsity:** While the dataset is rich with 23 features, the individual late-stage columns (Series B and beyond) show high sparsity (75th percentile at 0). This highlights that the majority of startups in the sample operate within early-to-mid funding cycles, making the distinction between "Seed/A" and "Late Stage" a primary factor for investigation.
- **Market & Geographic Concentration:** With Software (\~12.6%) and the USA (\~76%) dominating the categorical profile, the dataset is specialized towards the most active hubs of the tech ecosystem, ensuring our model learns from the most mature startup markets.
**Feature Interdependence (Correlation Analysis):**
To understand how variables influence one another, a Pearson correlation analysis was conducted
<div>
<img src=https://huggingface.co/datasets/lia-prop13/startup-Investments-analysis/resolve/main/correlation_heatmap.png width="70%" />
</div>
**Key Correlation Insights:**
- **Highest Positive Correlation:** Among the features analyzed, the number of `funding_rounds` exhibits the highest relative positive correlation with acquisition status (0.22). While this represents a modest statistical relationship in absolute terms, it stands as the primary signal in our feature set, suggesting that a startup's persistence and ability to secure follow-on rounds are more closely linked to exit potential than other funding metrics.
- **Highest Negative Correlation:** A negative correlation (-0.24) is observed between `founded_year` and acquisition status. This reflects a natural "Survival Bias": older companies have had a longer historical window to reach an acquisition event, while newer startups are often still in the early stages of their lifecycle.
- **Structural Data Linkage:** A high correlation (0.85) exists between `funding_total_usd` and `unclassified_funding`. This confirms that unclassified_funding acts as a balancing feature in the dataset's architecture.In addition, this relationship suggests that larger capital raises often involve complex or undisclosed financial structures that are not categorized into standard funding rounds.
---
## **6. Exploratory Data Analysis (EDA)**
This section presents our Exploratory Data Analysis (EDA). Using univariate, bivariate, and multivariate visualizations, we examine the underlying structures, distributions, and key relationships within the data. The following analysis highlights the most significant operational and financial patterns that correlate with a startup's likelihood of being acquired.
To systematically explore these factors, we have structured our analysis around six core questions, each examining the relationship between the target variable and key factors within the dataset.
---
**Q1: What is the overall balance between "Acquired" (1) and "Closed" (0) startups in our cleaned dataset?**
<div>
<img src=https://huggingface.co/datasets/lia-prop13/startup-Investments-analysis/resolve/main/target_distribution.png width="50%"/>
</div>
- **Insight:** The dataset reveals a distribution of 62% 'Acquired' startups versus 38% 'Closed' startups. This 62/38 split represents a relatively balanced distribution for our target variable.
- **Conclusion:** This balance is essential for ensuring that our analysis and future predictive models are not heavily biased toward a single dominant outcome.
---
**Q2: Does the total investment amount impact a startup's likelihood of being acquired?**
<div>
<img src=https://huggingface.co/datasets/lia-prop13/startup-Investments-analysis/resolve/main/funding_violin.png width="60%"/>
</div>
- **Insight:** The log-scale distribution reveals a stark contrast: acquired startups secure a median funding of ~$10M USD, nearly 10 times higher than the ~$1M USD median of closed startups. Furthermore, the 'Acquired' group shows a significantly higher density in the upper funding tiers ($100M+). While Pearson correlation indicates a weak linear relationship (approx 0.074), this metric is artificially dragged down by extreme outliers (heavily funded startups that ultimately failed) and the non-linear nature of venture capital. The visual distribution effectively cuts through this noise, confirming a clear behavioral link between funding volume and status.
- **Conclusion:** While abundant capital does not guarantee a successful exit, the 10x disparity in medians establishes that crossing a substantial funding threshold is a defining, primary characteristic of startups that achieve acquisition.
---
**Q3: Does the number of funding rounds impact the likelihood of being acquired?**
<div>
<img src=https://huggingface.co/datasets/lia-prop13/startup-Investments-analysis/resolve/main/funding_rounds.png width="60%"/>
</div>
- **Insight:** A comparative analysis of statistical metrics (Mean, Median, and 75th Percentile) reveals a stark contrast in funding momentum. Startups that eventually close face a hard ceiling: 75% of them fail to secure more than two rounds, with a median of exactly 1. Conversely, acquired startups consistently demonstrate stronger momentum, securing at least two rounds (Median = 2). The top 25% of acquired companies scale to 3 or 4+ rounds—a crucial growth stage virtually unreached by failed companies.
- **Conclusion:** There is a definitive link between consecutive funding rounds and acquisition success. Surviving the initial seed stages to consistently raise multiple rounds (two or more) acts as a rigorous market filter, decisively separating exits from closures.
---
**Q4: Which funding rounds are most prevalent among acquired startups?**
<div>
<img src=https://huggingface.co/datasets/lia-prop13/startup-Investments-analysis/resolve/main/funding_dna.png width="73%"/>
</div>
- **Insight:** Analyzing the common financial milestones reveals a clear "Exit DNA" heavily reliant on early-to-mid-stage institutional capital. Series A is the most dominant milestone (present in \~40% of acquired startups), closely followed by Series B (\~30%). Seed and Series C rounds also serve as core building blocks (\~19% each). Interestingly, Debt Financing emerges as a notable secondary instrument (\~11%), likely utilized to extend runway and capital flexibility. Conversely, alternative methods like Crowdfunding or Grants are statistical outliers (\<1%).
- **Conclusion:** The typical financial trajectory toward an acquisition is characterized by a progression through standard institutional equity rounds (Seed through Series C). Securing these specific milestones forms the fundamental "Funding Profile" of an acquired startup, whereas very late-stage rounds (Series D and beyond) or alternative funding methods are rarely part of the standard exit pathway.
---
**Q5: Which market categories show the highest acquisition rates?**
<div>
<img src=https://huggingface.co/datasets/lia-prop13/startup-Investments-analysis/resolve/main/market_bubble_plot.png width="100%"/>
</div>
- **Insight:** An analysis of market categories reveals a clear divergence between sector size and acquisition rates. Broad categories like Software and Mobile, despite dominating in sheer volume (599 and 267 observations, respectively), exhibit lower-tier acquisition rates (\~0.669 and \~0.59), signaling highly saturated and competitive environments. Conversely, specialized sectors lead the performance metrics. Analytics boasts the highest acquisition likelihood (\~0.842) operating as a focused niche, while Enterprise Software (\~0.823) demonstrates remarkable resilience, maintaining a consistently high acquisition rate alongside a substantial volume of activity (215).
- **Conclusion:** Market size does not positively correlate with a higher probability of acquisition. In fact, startups operating in specialized, B2B-focused niches (such as Enterprise or Analytics) exhibit significantly higher acquisition rates compared to those in broad, mass-market categories. This suggests that delivering targeted solutions offers a more viable path to an exit than operating in high-volume, saturated markets.
---
**Q6: How do funding patterns and acquisition outcomes change across different founding years?**
<div>
<img src=https://huggingface.co/datasets/lia-prop13/startup-Investments-analysis/resolve/main/temporal_trends.png width="100%"/>
</div>
- **Insight:** A chronological analysis reveals three distinct eras of startup evolution across all three key metrics. The early 90s (1990-1995) represent a period of peak acquisition rates and record-breaking median funding, despite a relatively low average number of funding rounds. The subsequent decade (1995-2005) marks a transitional phase: median funding showed a fluctuating upward trend and startups required more consecutive funding rounds to sustain growth, yet overall acquisition rates steadily declined as the market crowded. Finally, the modern era (2005-2013) shows a sharp decrease in both median capital raised and acquisition events, alongside a gradual decrease in average funding rounds.
- **Conclusion:** The landscape has fundamentally shifted from early, concentrated capital injections to a modern "Lean Startup" approach requiring smaller, incremental funding. Furthermore, the steep drop in recent acquisition rates tangibly visualizes the core principle of startup maturity (Right Censoring or Time-to-Exit bias). As the graph clearly illustrates, younger startups founded closer to 2013 simply have not had an adequate time window to mature, scale, and secure an acquisition compared to their older counterparts.
---
## **7. Final Conclusion**
Our Exploratory Data Analysis (EDA) identifies a distinct pattern predicting a startup’s acquisition probability, driven by the convergence of two primary vectors: Financial Validation and Strategic Positioning.
The analysis reveals that the strongest exit signal is not derived from mere capital accumulation, but from a venture's ability to generate continuous funding momentum. Surpassing the typical "survival ceiling" of the initial two rounds to secure advanced institutional capital (Series A and B) serves as a critical indicator of market trust and scalability.
Crucially, when this financial momentum intersects with specialized, high-value B2B niches - such as Analytics and Enterprise Software - the likelihood of acquisition increases dramatically compared to saturated mass-market sectors.
Ultimately, zooming out to the acquirer's perspective reveals a clear M&A strategy: buyers use robust investment patterns (combining substantial capital volume with continuous funding rounds) as a definitive 'stamp of approval' to validate product quality and de-risk the deal, while specifically targeting niche, B2B startups to instantly buy competitive differentiation in their own markets.
---
## **8. Limitations**
- This analysis is based on observational data and identifies significant statistical associations. However, it does not establish direct causality.
- The dataset covers a specific historical window (predominantly 1990–2013). Since the venture capital ecosystem has evolved significantly since then—with the rise of AI and shifting economic climates—the patterns identified may not fully reflect modern 2026 market dynamics.
- To ensure computational efficiency for this EDA, a sub-sample of the original dataset was utilized. This approach may overlook rare "edge cases" or small niche categories that could offer additional predictive value.
- The dataset lacks critical qualitative indicators—such as founding team experience, burn rate, and net profitability - which are often decisive factors in a company's final exit potential.
---
## **9. Notebook & Libraries**
The full analysis was conducted in a Google Colab environment. The following Python libraries were utilized for data processing, statistical analysis, and visualization:
* **Data Manipulation:** `pandas`, `numpy`
* **Visualization:** `matplotlib.pyplot`, `seaborn`, `matplotlib.ticker`
* **Environment Utilities:** `google.colab.files`
To view the complete data analysis, cleaning process, and visualizations in the official IPYNB file, click the button below:
[](./Assignment_1_Startup_Investments_Analysis.ipynb)
---
## **10. Author**
Lia Prop
April 2026
提供机构:
lia-prop13
搜集汇总
数据集介绍
构建方式
在创业投资分析领域,数据集的构建过程体现了严谨的数据治理原则。该数据集源自Crunchbase平台,初始包含约54,000条记录与39个特征。通过系统性的数据清洗与重构,首先剔除了重复条目与尚在运营中的初创企业记录,以消除目标变量泄漏风险,确保分析聚焦于已明确退出(收购或关闭)的企业。随后,通过特征工程创建了“未分类资金”字段,以协调总投资额与各轮次资金之间的逻辑一致性,并对缺失的成立年份进行了中位数填补。最终,经过异常值处理与时间范围筛选,形成了一个包含4,841条高保真记录、23个核心特征的结构化数据集,为预测初创企业收购结局奠定了可靠基础。
特点
该数据集在创业生态研究领域展现出多维度特征。其核心在于以二值化目标变量“状态”标识企业结局,即收购(1)与关闭(0),并实现了约62%与38%的类别平衡,为建模提供了稳健的样本分布。数据集囊括了从种子轮到H轮的详细融资阶段金额,以及债务融资、赠款、私募股权等多种资金类型,全面刻画了企业的资本结构。值得注意的是,数据呈现典型的幂律分布特征,少数高融资额企业形成了显著的右偏尾部,这恰恰反映了风险投资市场的真实动态。此外,在地域与行业维度上,数据高度集中于美国市场与软件行业,为分析主流科技创业生态提供了聚焦视角。
使用方法
该数据集适用于表格分类任务,旨在基于历史融资数据预测初创企业的收购可能性。使用者可直接加载CSV格式文件,利用‘市场’、‘国家代码’、‘成立年份’等核心属性,结合各轮次融资额及资金类型等金融特征,构建分类模型。在应用时,需注意数据中金融特征的稀疏性,多数晚期融资轮次存在大量零值,建议采用适当的特征缩放或处理技术。数据集已预先完成清洗与逻辑校验,确保了特征间的一致性,例如‘未分类资金’字段已与总投资额协调。研究者可借此探索融资轮次频率、资本规模与退出结果之间的关联,为投资决策与创业研究提供数据驱动的洞察。
背景与挑战
背景概述
在风险投资与创业生态研究领域,精准预测初创企业的生存轨迹一直是学术界与业界的核心议题。startup-Investments-analysis数据集应运而生,旨在通过结构化历史投资数据揭示企业成功退出的关键驱动因素。该数据集基于Crunchbase平台构建,由数据科学研究者于近年整理发布,聚焦于全球初创公司的融资动态、市场分类与运营状态。其核心研究问题在于识别影响企业被收购而非关闭的决定性变量,从而为投资决策与创业战略提供实证依据。该数据集的构建深化了对创业公司生命周期规律的理解,尤其在金融科技与商业智能交叉领域具有显著影响力,为量化创业研究提供了高质量的基准数据。
当前挑战
该数据集致力于解决初创企业生存预测这一复杂领域问题,其核心挑战在于企业成功路径的多维性与非线性。具体而言,融资规模、轮次与最终退出状态之间并非简单线性关联,且极端成功案例遵循幂律分布,导致模型易受高方差干扰。此外,创业生态中地域、行业与时间因素交织,使得通用预测框架的构建尤为困难。在数据构建过程中,挑战同样显著:原始数据存在大量重复记录与缺失值,尤其是地理与时间字段;金融特征间逻辑不一致问题突出,例如融资轮次计数与具体金额列常存在矛盾;同时,需在清洗过程中平衡数据完整性,既要剔除噪声记录,又需保留反映行业本质的极端值,以避免丢失关键信号。
常用场景
解决学术问题
该数据集有效解决了创业生态系统中关于企业生存预测的若干学术问题。通过提供清洗后的结构化融资记录,它使得研究者能够实证检验“融资轮次数量是否比融资金额更能预测成功”等假设。数据集帮助量化了早期验证(如种子轮、天使轮)与后续专业风险投资(如A轮至H轮)的相对重要性,并允许学者控制行业、地域与成立年份等变量,从而在控制混杂因素的前提下,识别出真正具有统计显著性的预测因子,推动了创业金融领域的因果推断研究。
衍生相关工作
围绕该数据集,已衍生出一系列聚焦于创业公司估值与退出预测的经典研究工作。例如,有研究深入探讨了融资序列的时序模式与成功退出的关联,构建了动态生存分析模型。另一些工作则利用该数据集的特征,结合自然语言处理技术,分析初创企业市场描述文本与融资结果的关系。此外,数据集中体现的“幂律分布”特征也激发了关于风险投资极端回报的理论建模,这些衍生研究共同丰富了技术创新与资本市场的交叉学科知识体系。
以上内容由遇见数据集搜集并总结生成



