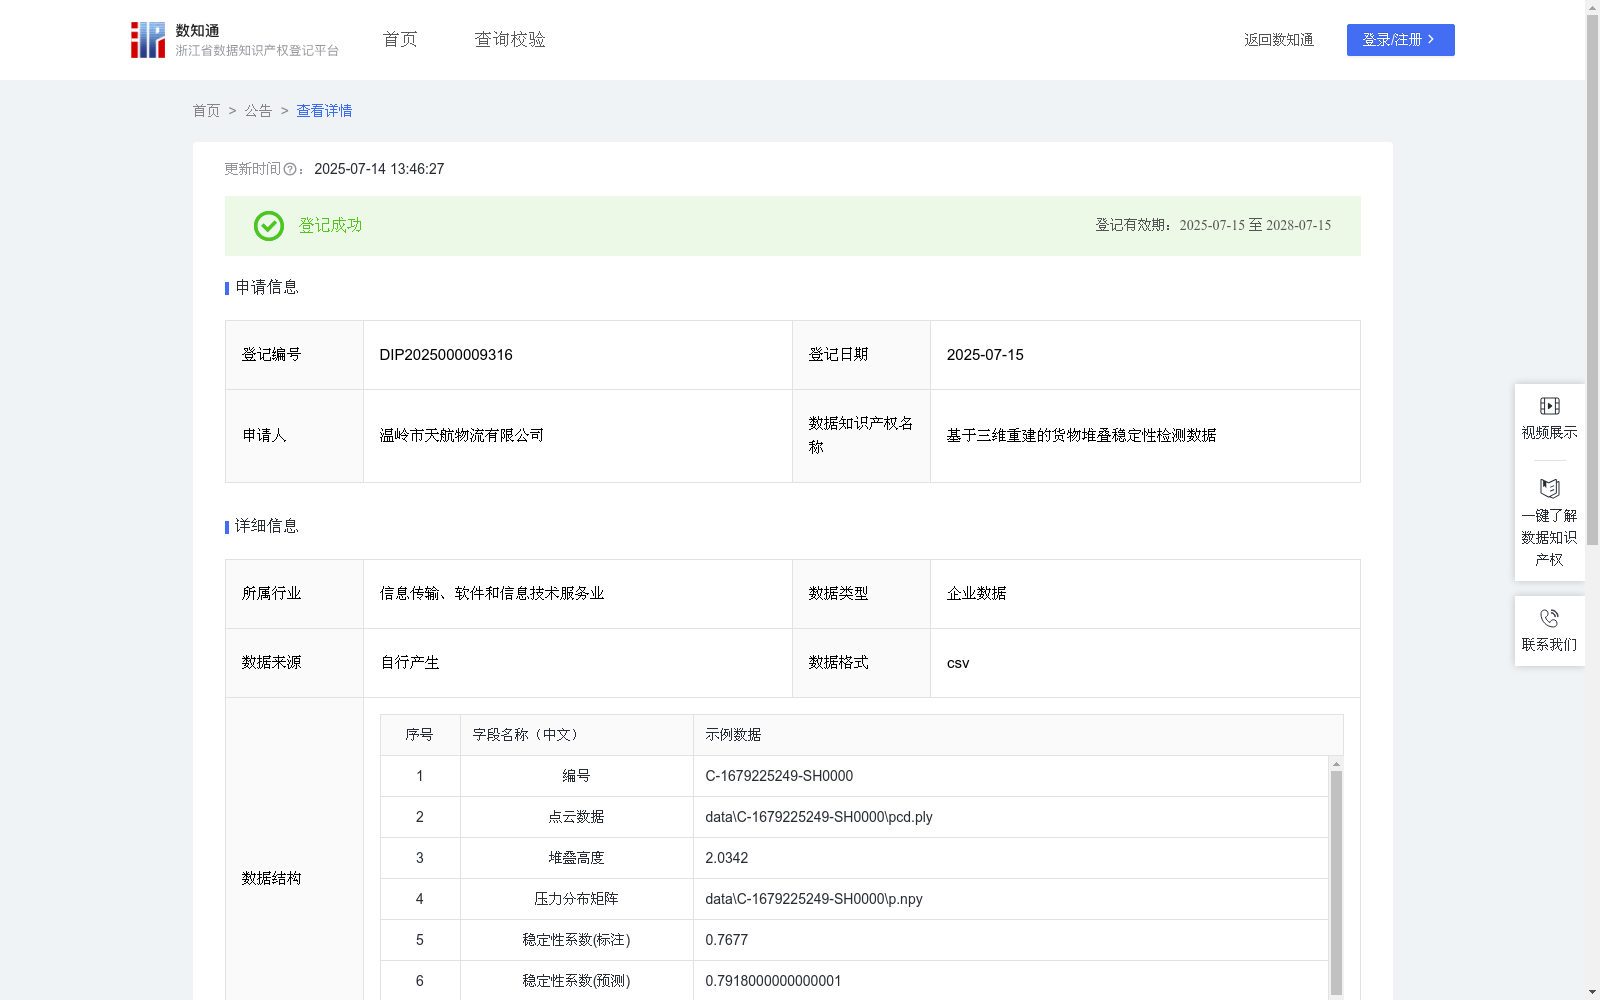
基于三维重建的货物堆叠稳定性检测数据
收藏浙江省数据知识产权登记平台2025-07-14 更新2025-07-15 收录
下载链接:
https://www.zjip.org.cn/home/announce/trends/148515
下载链接
链接失效反馈官方服务:
资源简介:
该数据在仓储货物堆垛监测中具有重要的应用价值。能够提供立体空间建模,更精确地分析货物受力分布,帮助仓库管理员进行堆叠安全预警。在零担货运、大宗商品仓储领域具有广泛的应用场景,特别是托盘货物堆叠、集装箱内部装载和人力搬运过程监控场景,能够提高堆垛安全系数,降低货物倒塌事故率,提供三维空间重建能力。 数据收集:
通过深度相机阵列采集货物堆叠三维数据:ToF深度相机以640×480分辨率获取点云数据(.ply格式);压力传感器阵列记录各层货物承重分布(压力分布矩阵) ;激光测距仪测量堆叠总高度(单位:米);专家标注的稳定性系数作为监督标签(0-1区间)
数据预处理:
1. 点云降采样:将原始点云密度降低至每立方米5000个点
2. 坐标对齐:将多视角点云统一到世界坐标系
3. 压力矩阵标准化:将压力值映射到[0,1]区间
4. 高度补偿:根据温度变化校正激光测距数据
模型构建:
采用多模态融合神经网络架构,包含点云特征提取和压力分布预测双分支:V = Φ(P)×Ψ(H) + Θ(M) 。式中参数说明:P 表示预处理后的点云坐标集合(N×3矩阵);H 为堆叠高度测量值;M为压力分布矩阵;Φ 为PointNet++网络提取的128维点云特征;Ψ 为高度特征转换的全连接层;Θ 为压力矩阵卷积编码器。模型输出稳定性系数V∈[0,1],当V<0.6时触发预警。通过计算三维重建结果与真实点云的结构相似性(SSIM),以及预测压力分布与实际测量的均方误差(MSE)评估模型性能。结构相似性=特征相似度×空间相关性,压力预测误差=Σ(预测值-真实值)^2/N。
This dataset holds significant application value in cargo stacking monitoring for warehouses. It enables 3D spatial modeling, more accurate analysis of cargo stress distribution, and assists warehouse managers in implementing stacking safety early warnings. It has broad application scenarios in the fields of less-than-truckload (LTL) freight and bulk commodity storage, particularly in palletized cargo stacking, container internal loading, and manual handling process monitoring scenarios. It can improve the stacking safety factor, reduce the cargo collapse accident rate, and provide 3D spatial reconstruction capabilities.
Data Collection:
3D data of cargo stacks is collected via a depth camera array:
- Time-of-Flight (ToF) depth cameras acquire point cloud data (in .ply format) at a resolution of 640×480;
- Pressure sensor arrays record the load-bearing distribution of cargo at each layer (pressure distribution matrix);
- Laser rangefinders measure the total stacking height (unit: meter);
- Expert-labeled stability coefficients serve as supervisory labels, ranging within the interval [0, 1].
Data Preprocessing:
1. Point Cloud Downsampling: Reduce the original point cloud density to 5000 points per cubic meter
2. Coordinate Alignment: Unify multi-view point clouds into the world coordinate system
3. Pressure Matrix Standardization: Map pressure values to the [0, 1] interval
4. Height Compensation: Correct laser ranging data based on temperature variations
Model Construction:
A multimodal fusion neural network architecture is adopted, which includes two branches: point cloud feature extraction and pressure distribution prediction, expressed as: $V = Phi(P) imes Psi(H) + Theta(M)$. Parameter explanations are as follows:
- P represents the preprocessed point cloud coordinate set (N×3 matrix);
- H is the measured stacking height;
- M is the pressure distribution matrix;
- $Phi$ denotes the 128-dimensional point cloud features extracted by the PointNet++ network;
- $Psi$ is the fully connected layer for height feature transformation;
- $Theta$ is the convolutional encoder for the pressure matrix.
The model outputs the stability coefficient $V in [0, 1]$, and an early warning is triggered when $V < 0.6$. Model performance is evaluated by calculating the structural similarity index measure (SSIM) between the 3D reconstruction results and the real point cloud, as well as the mean squared error (MSE) between the predicted pressure distribution and actual measurements. Structural similarity = feature similarity × spatial correlation, and pressure prediction error = $sum (predicted value - true value)^2 / N$.
提供机构:
温岭市天航物流有限公司
创建时间:
2025-06-25
搜集汇总
数据集介绍
背景与挑战
背景概述
该数据集包含3625条记录,用于仓储货物堆垛监测,通过三维重建和受力分析提高堆垛安全性。数据格式为CSV,包含点云数据、堆叠高度、压力分布矩阵等关键字段,采用多模态融合神经网络进行模型构建。
以上内容由遇见数据集搜集并总结生成


