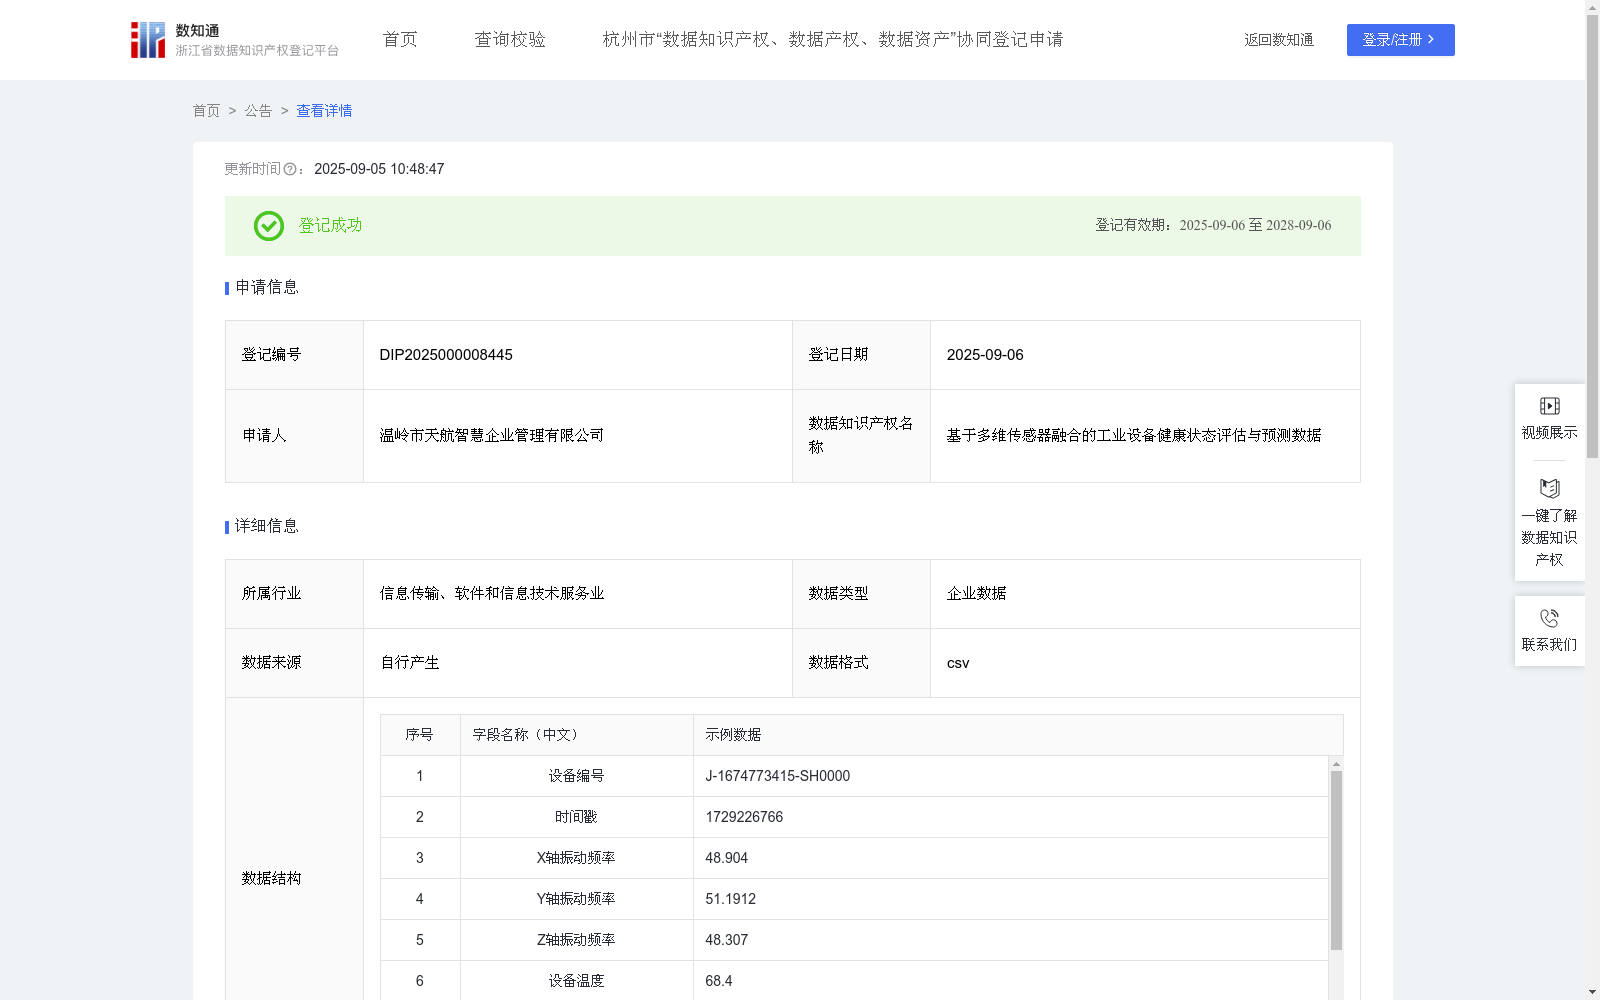
基于多维传感器融合的工业设备健康状态评估与预测数据
收藏浙江省数据知识产权登记平台2025-09-05 更新2025-09-06 收录
下载链接:
https://www.zjip.org.cn/home/announce/trends/175371
下载链接
链接失效反馈官方服务:
资源简介:
该数据在工业设备预测性维护领域具有重要的应用价值。能够提供设备实时的健康状态评估,更精确地预测潜在的故障风险,帮助设备维护工程师和生产管理者进行前瞻性的维护决策。这项数据在智能制造领域具有广泛的应用场景,特别是旋转类设备(如电机、泵)的状态监测、复杂生产线关键节点的故障预警和大型数控机床的健康管理,能够提高设备综合利用率(OEE),降低非计划停机带来的经济损失,提供更科学的备件库存管理依据。数据收集:在该算法中,我们通过部署在工业设备上的多维传感器来收集数据。数据源包括:通过加速度传感器采集的X轴振动频率(赫兹)、Y轴振动频率(赫兹)、Z轴振动频率(赫兹);通过温度传感器采集的设备温度(摄氏度);以及通过电流传感器采集的运行电流( 安培)。每一个数据点都包含唯一的设备编号和采集时刻的时间戳。故障标签来源于历史维护记录和人工标注,其中“0”代表正常,“1”代表即将发生故障,该标签是模型训练的监督信号。
数据预处理:对收集到的多维时间序列数据进行预处理。首先,进行数据清洗,处理缺失值和异常值。
模型构建:利用基于长短期记忆网络(LSTM)的深度学习模型对设备的健康状态进行评估和预测。模型输入为预处理后的多维传感器数据序列,输出为预测故障概率和预测剩余寿命(天)。模型通过学习历史数据中从正常到故障的演变模式,来预测未来状态。具体算法机理可通过以下公式表达:
公式一:Ht = LSTM_Cell(Xt, Ht-1)
公式解释:此公式为LSTM单元的核心计算。其中,Xt代表在当前时间点输入的包含X轴振动频率、Y轴振动频率、Z轴振动频率、设备温度、运行电流等信息的多维数据向量。Ht-1是前一时间点的隐藏状态,它包含了过去序列的信息。LSTM_Cell是一个非线性函数单元,它会根据当前输入Xt和过去的记忆Ht-1来计算并输出当前时间点的隐藏状态Ht。通过这种循环传递,模型能够捕捉时间序列数据中的长期依赖关系。
公式二:预测故障概率 = Sigmoid(W * H_final + b)
公式解释:此公式用于计算最终的故障预测结果。其中,H_final是LSTM网络处理完整个输入序列后输出的最终隐藏状态,也就是公式一最后一个时刻的输出,它浓缩了整个时间窗口内的设备状态信息。W和b是模型全连接层的权重和偏置,通过训练学习得到。Sigmoid是一个激活函数,它将任意实数值映射到(0, 1)区间,输出的结果即为预测故障概率。当该概率超过预设阈值时,系统则判定设备即将发生故障。同时,模型的另一分支也可以利用H_final来回归计算出具体的预测剩余寿命。整个模型训练的目标是最小化预测结果(预测故障概率)与故障标签之间的差异。
This dataset holds significant application value in the field of industrial equipment predictive maintenance. It can provide real-time health status assessment of equipment, more accurately predict potential fault risks, and assist equipment maintenance engineers and production managers in making proactive maintenance decisions.
This dataset has a wide range of application scenarios in the intelligent manufacturing field, especially for condition monitoring of rotating equipment (such as motors and pumps), fault early warning at key nodes of complex production lines, and health management of large CNC machine tools. It can improve Overall Equipment Effectiveness (OEE), reduce economic losses caused by unplanned downtime, and provide a more scientific basis for spare parts inventory management.
Data Collection: In this algorithm, data is collected via multi-dimensional sensors deployed on industrial equipment. The data sources include: X-axis vibration frequency (Hz), Y-axis vibration frequency (Hz), and Z-axis vibration frequency (Hz) collected by acceleration sensors; equipment temperature (°C) collected by temperature sensors; and operating current (A) collected by current sensors. Each data point contains a unique equipment ID and a timestamp of the collection moment. Fault labels are derived from historical maintenance records and manual annotations, where "0" represents normal status and "1" represents impending fault, and this label serves as the supervision signal for model training.
Data Preprocessing: Preprocessing is performed on the collected multi-dimensional time series data. First, data cleaning is carried out to handle missing values and outliers.
Model Construction: A deep learning model based on Long Short-Term Memory (LSTM) networks is used to evaluate and predict the health status of equipment. The model takes the preprocessed multi-dimensional sensor data sequence as input, and outputs the predicted fault probability and predicted remaining useful life (in days). The model predicts future states by learning the evolution patterns from normal to fault in historical data. The specific algorithm mechanism can be expressed by the following formulas:
Formula 1: $H_t = LSTM_Cell(X_t, H_{t-1})$
Formula Explanation: This formula is the core calculation of the LSTM unit. Here, $X_t$ represents the multi-dimensional data vector input at the current time point, which includes information such as X-axis vibration frequency, Y-axis vibration frequency, Z-axis vibration frequency, equipment temperature, and operating current. $H_{t-1}$ is the hidden state at the previous time point, which contains information from the past sequence. $LSTM_Cell$ is a nonlinear functional unit that calculates and outputs the hidden state $H_t$ at the current time point based on the current input $X_t$ and the past memory $H_{t-1}$. Through this cyclic transmission, the model can capture long-term dependencies in time series data.
Formula 2: Predicted Fault Probability = Sigmoid(W * $H_{final}$ + b)
Formula Explanation: This formula is used to calculate the final fault prediction result. Here, $H_{final}$ is the final hidden state output by the LSTM network after processing the entire input sequence, which is the output at the last time step of Formula 1, and it condenses the equipment status information within the entire time window. W and b are the weights and biases of the model's fully connected layer, which are learned through training. Sigmoid is an activation function that maps any real value to the interval (0, 1), and the output result is the predicted fault probability. When this probability exceeds a preset threshold, the system determines that the equipment is about to fail. In addition, another branch of the model can also use $H_{final}$ to regress and calculate the specific predicted remaining useful life. The overall training objective of the model is to minimize the difference between the predicted results (predicted fault probability) and the fault labels.
提供机构:
温岭市天航智慧企业管理有限公司
创建时间:
2025-06-20
搜集汇总
数据集介绍
背景与挑战
背景概述
该数据集包含5037条CSV格式的工业设备传感器数据,用于基于LSTM模型评估和预测设备健康状态,关键字段包括多维振动频率、温度、电流以及故障标签和预测指标。它主要应用于智能制造领域的预测性维护,如电机和泵的状态监测,旨在提高设备利用率并减少非计划停机损失。
以上内容由遇见数据集搜集并总结生成


