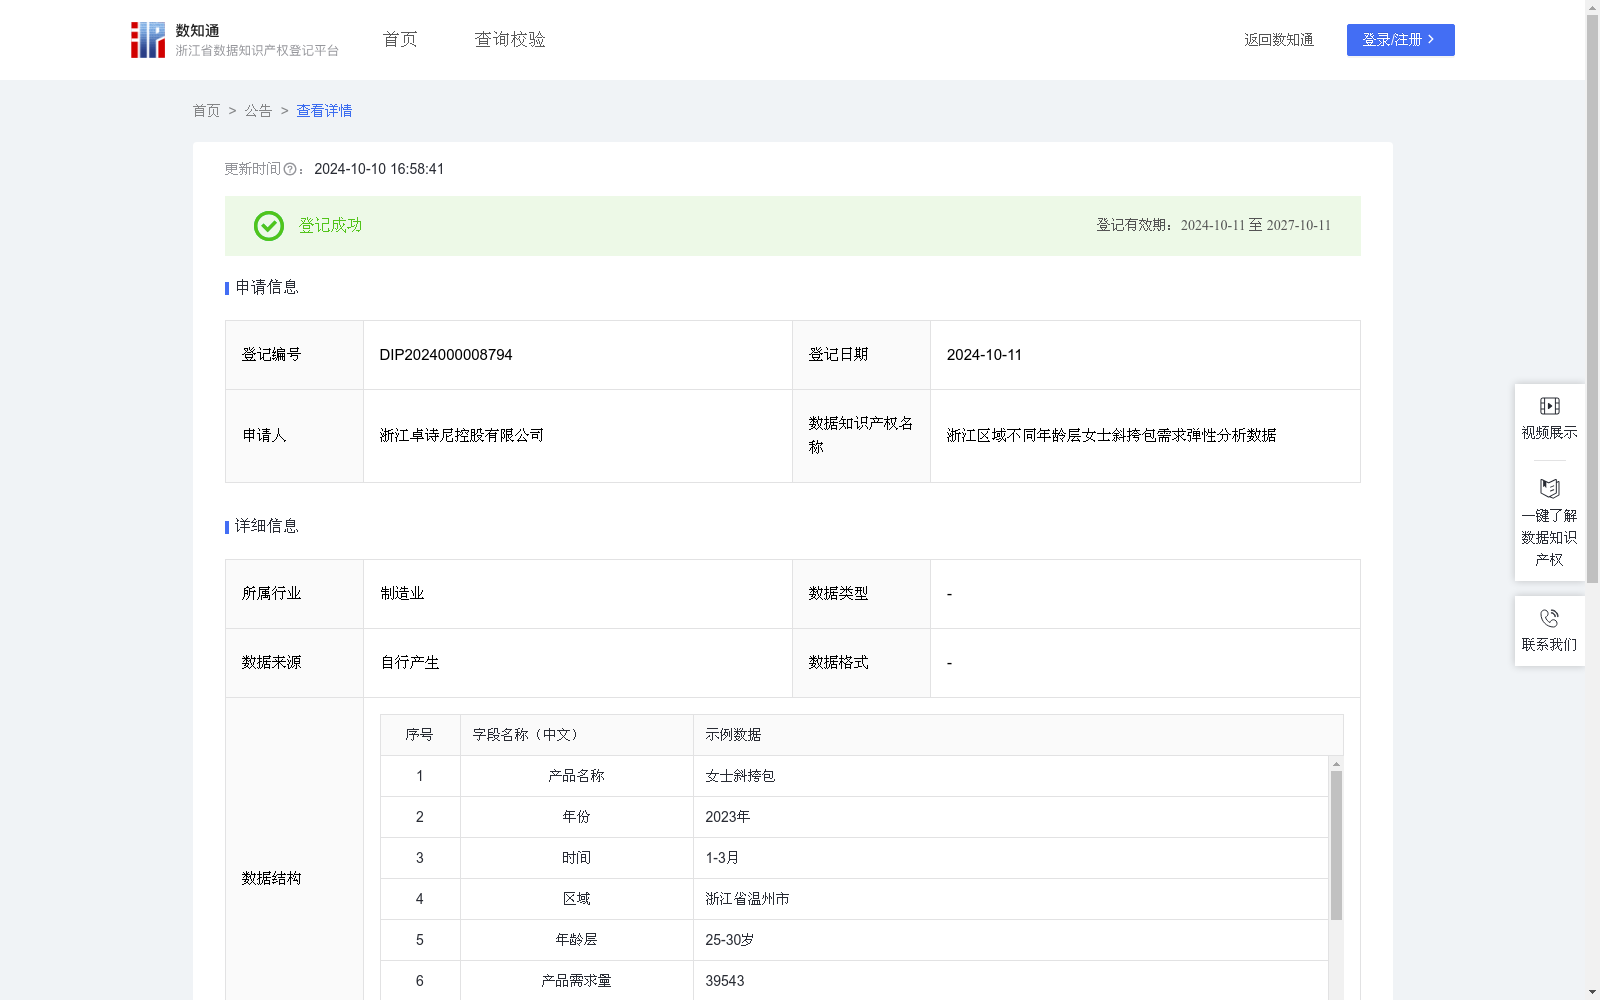
浙江区域不同年龄层女士斜挎包需求弹性分析数据
收藏资源简介:
根据浙江区域不同年龄层客群对女士斜挎包的市场需求情况,计算分析该产品在某时间段的需求量对于价格变动做出反应的敏感程度即需求弹性系数。如果需求富有弹性,可以适当降低价格来获得较多的收益;如果需求缺乏弹性,可以适当提高价格来获得较多的收益。该项数据帮助企业理解市场需求弹性以及价格变动对需求的影响,预测不同价格水平下消费者的购买意愿,提高价格策略的科学性和准确性,对于不同行业的不同产品的区域定价决策也具有应用价值。 1.数据采集:采集相关女士斜挎包女士斜挎包产品在浙江区域某时间段的需求数据和价格数据,通过“需求弹性和供给弹性”对该数据进行整理归纳,得到该产品的需求量变动数值和价格变化数值。 2.算法规则:对采集到的数据按照如下公式计算:需求弹性系数Ed=-(△Q/Q)÷(△P/P)。式中:△Q表示需求量同比变动值,Q表示产品的需求量;△P表示价格同比变动值,P表示产品的价格。取需求弹性系数的绝对值|Ed|作为分析需求弹性的参考系数。 3.数据分析:根据|Ed|的数值可分析产品的需求弹性。(1)|Ed|=1(单位需求价格弹性),说明需求量变动幅度与价格变动幅度相同;(2)|Ed| >1(需求富有弹性),说明需求量变动幅度大于价格变动幅度;(3)|Ed|<1(需求缺乏弹性),说明需求量变动幅度小于价格变动幅度。
Based on the market demand for women's crossbody bags from customer groups of different age brackets in the Zhejiang region, this dataset calculates and analyzes the sensitivity of the product's demand quantity to price changes over a certain period, namely the demand elasticity coefficient. If the demand is elastic, the price can be appropriately reduced to obtain higher revenue; if the demand is inelastic, the price can be appropriately increased to obtain higher revenue. This dataset helps enterprises understand market demand elasticity and the impact of price changes on demand, predict consumers' purchase willingness at different price levels, improve the scientificity and accuracy of pricing strategies, and has application value for regional pricing decisions of different products in different industries. 1. Data Collection: Collect demand data and price data of women's crossbody bag products in the Zhejiang region over a certain period, organize and summarize this data by applying the theory of "demand elasticity and supply elasticity", and obtain the demand change value and price change value of the product. 2. Algorithm Rules: Calculate the collected data according to the following formula: Demand Elasticity Coefficient $E_d = -(Delta Q/Q) div (Delta P/P)$. In the formula: $Delta Q$ represents the year-on-year change in demand quantity, $Q$ represents the product's demand quantity; $Delta P$ represents the year-on-year change in price, $P$ represents the product's price. Take the absolute value $|E_d|$ of the demand elasticity coefficient as the reference coefficient for analyzing demand elasticity. 3. Data Analysis: The demand elasticity of the product can be analyzed based on the value of $|E_d|$. (1) $|E_d|=1$ (unitary price elasticity of demand): it indicates that the change range of demand quantity is the same as that of price; (2) $|E_d|>1$ (demand is elastic): it indicates that the change range of demand quantity is greater than that of price; (3) $|E_d|<1$ (demand is inelastic): it indicates that the change range of demand quantity is smaller than that of price.