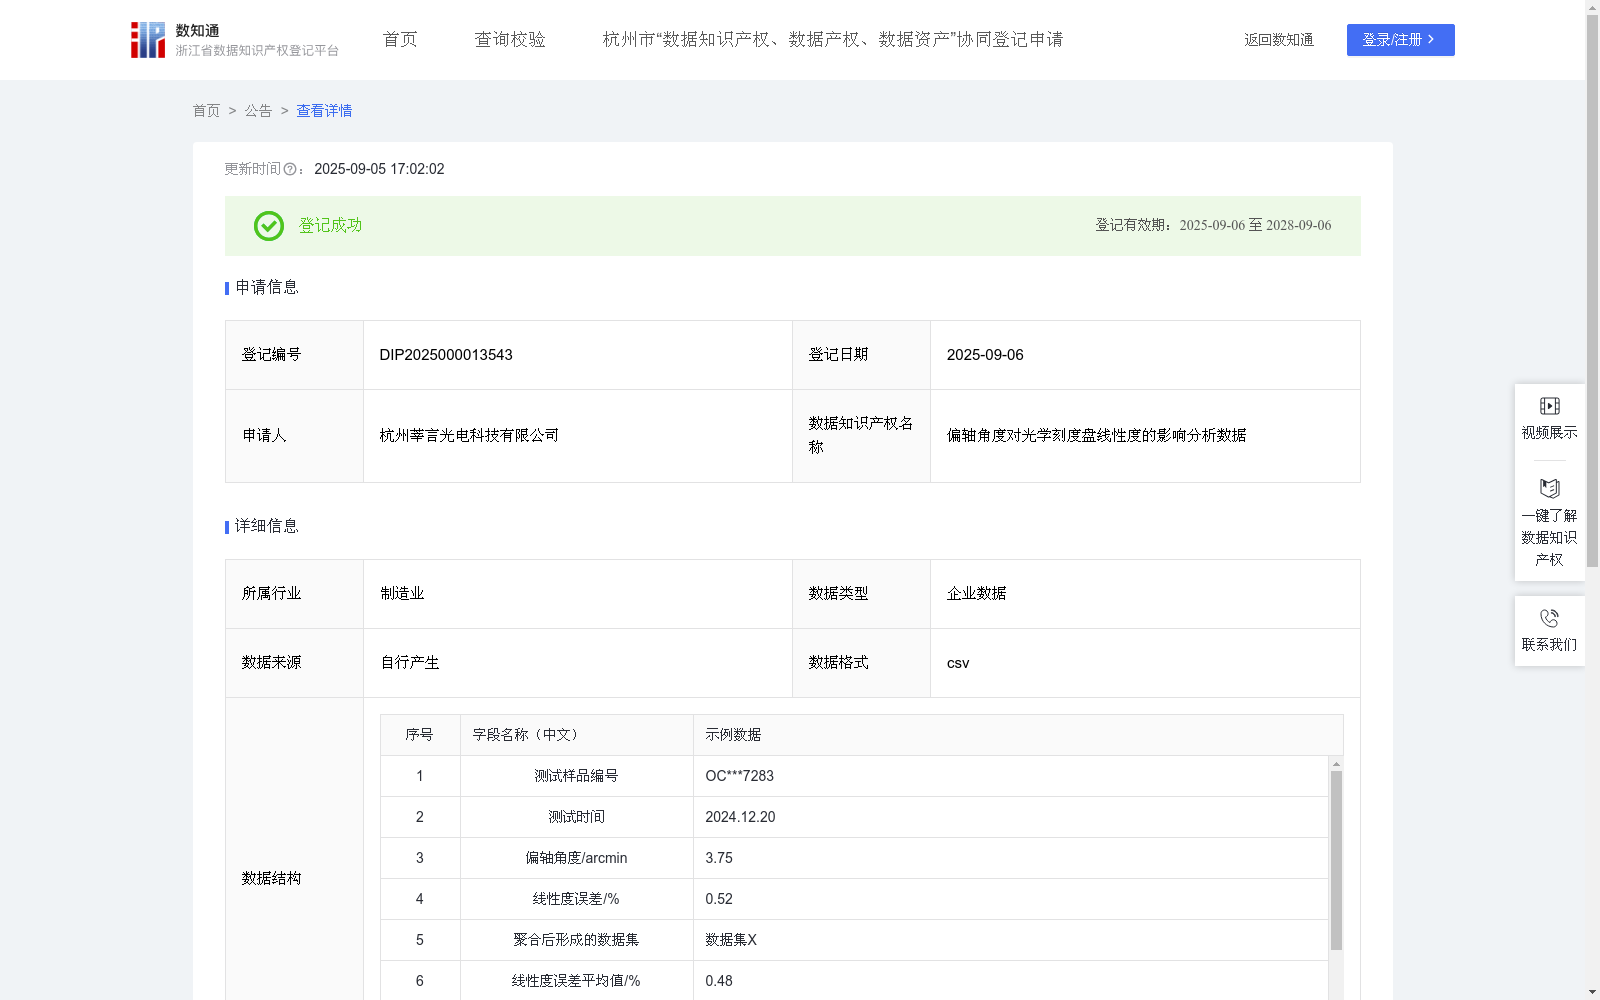
偏轴角度对光学刻度盘线性度的影响分析数据
收藏资源简介:
本数据聚焦于分析偏轴角度对光学刻度盘线性度的影响,揭示了光学系统对准精度与测量系统性能之间的量化关系,为公司(作为生产商)及外部相关方提供了重要的决策依据,具有显著的应用价值。具体体现在以下方面: 1.优化产品开发和生产工艺:公司可通过分析偏轴角度对线性度的影响,可以精准优化光学系统对准工艺,改进装配调试方案,科学制定安装公差标准和质量控制参数,提升产品测量精度和稳定性。 2.推动行业科技进步:本数据可以给光学仪器制造领域的相关科研工作者、技术研发人员、质量管理人员、产品检验人员等使用,为他们开展光学系统对准优化、线性度提升、质量控制、科学研究等工作提供支撑。1.数据采集: 实时记录不同偏轴角度条件下的光学刻度盘线性度测试数据,包括测试样品编号、测试时间、偏轴角度/arcmin、线性度误差/%等字段。 2.数据预处理: (1)对采集的数据进行去噪处理,确保数据准确性。 (2)将历史采集的数据(包含本次采集)进行聚合,形成数据集X,并针对数据集X中的线性度误差字段,计算出其平均值。 3.计算线性回归斜率a和截距b: (1)基于数据集X(以偏轴角度为自变量、线性度误差为因变量),运用SLOPE函数,基于最小二乘法原理确定斜率a,运用INTERCEPT函数确定截距b。 (2)斜率a表示单位偏轴角度变化对线性度误差的影响程度,截距b表示基准偏轴角度下光学刻度盘的线性度误差值。 4.结果运用: (1)计算比例系数k:k=|a/线性度误差平均值|×100%。 (2)若k≥10%,则判定为"高影响",若5%≤k<10%,则判定为"中影响",若k<5%,则判定为"低影响"。
This dataset focuses on analyzing the impact of off-axis angles on the linearity of optical dials, and reveals the quantitative relationship between the alignment accuracy of optical systems and the performance of measurement systems. It provides important decision-making support for the company (as a manufacturer) and external stakeholders, with significant application value, which is reflected in the following aspects: 1. Optimize product development and production processes: The company can accurately optimize the alignment process of optical systems, improve assembly and debugging schemes, scientifically formulate installation tolerance standards and quality control parameters, and enhance product measurement accuracy and stability by analyzing the impact of off-axis angles on linearity. 2. Promote scientific and technological progress in the industry: This dataset can be used by relevant researchers, technical R&D personnel, quality management personnel, product inspectors and other practitioners in the field of optical instrument manufacturing, providing support for their work such as optical system alignment optimization, linearity improvement, quality control and scientific research. 1. Data collection: Real-time record the linearity test data of optical dials under different off-axis angle conditions, including fields such as test sample number, test time, off-axis angle / arcmin, linearity error / %, etc. 2. Data preprocessing: (1) Denoise the collected data to ensure data accuracy. (2) Aggregate the historically collected data (including this collection) to form dataset X, and calculate the average value of the linearity error field in dataset X. 3. Calculate the linear regression slope a and intercept b: (1) Based on dataset X (with off-axis angle as the independent variable and linearity error as the dependent variable), use the SLOPE function to determine the slope a based on the principle of the least squares method, and use the INTERCEPT function to determine the intercept b. (2) The slope a represents the degree of influence of unit off-axis angle change on linearity error, and the intercept b represents the linearity error value of the optical dial at the reference off-axis angle. 4. Result application: (1) Calculate the proportional coefficient k: k = |a / average linearity error| × 100%. (2) If k ≥ 10%, it is judged as "high impact"; if 5% ≤ k < 10%, it is judged as "medium impact"; if k < 5%, it is judged as "low impact".