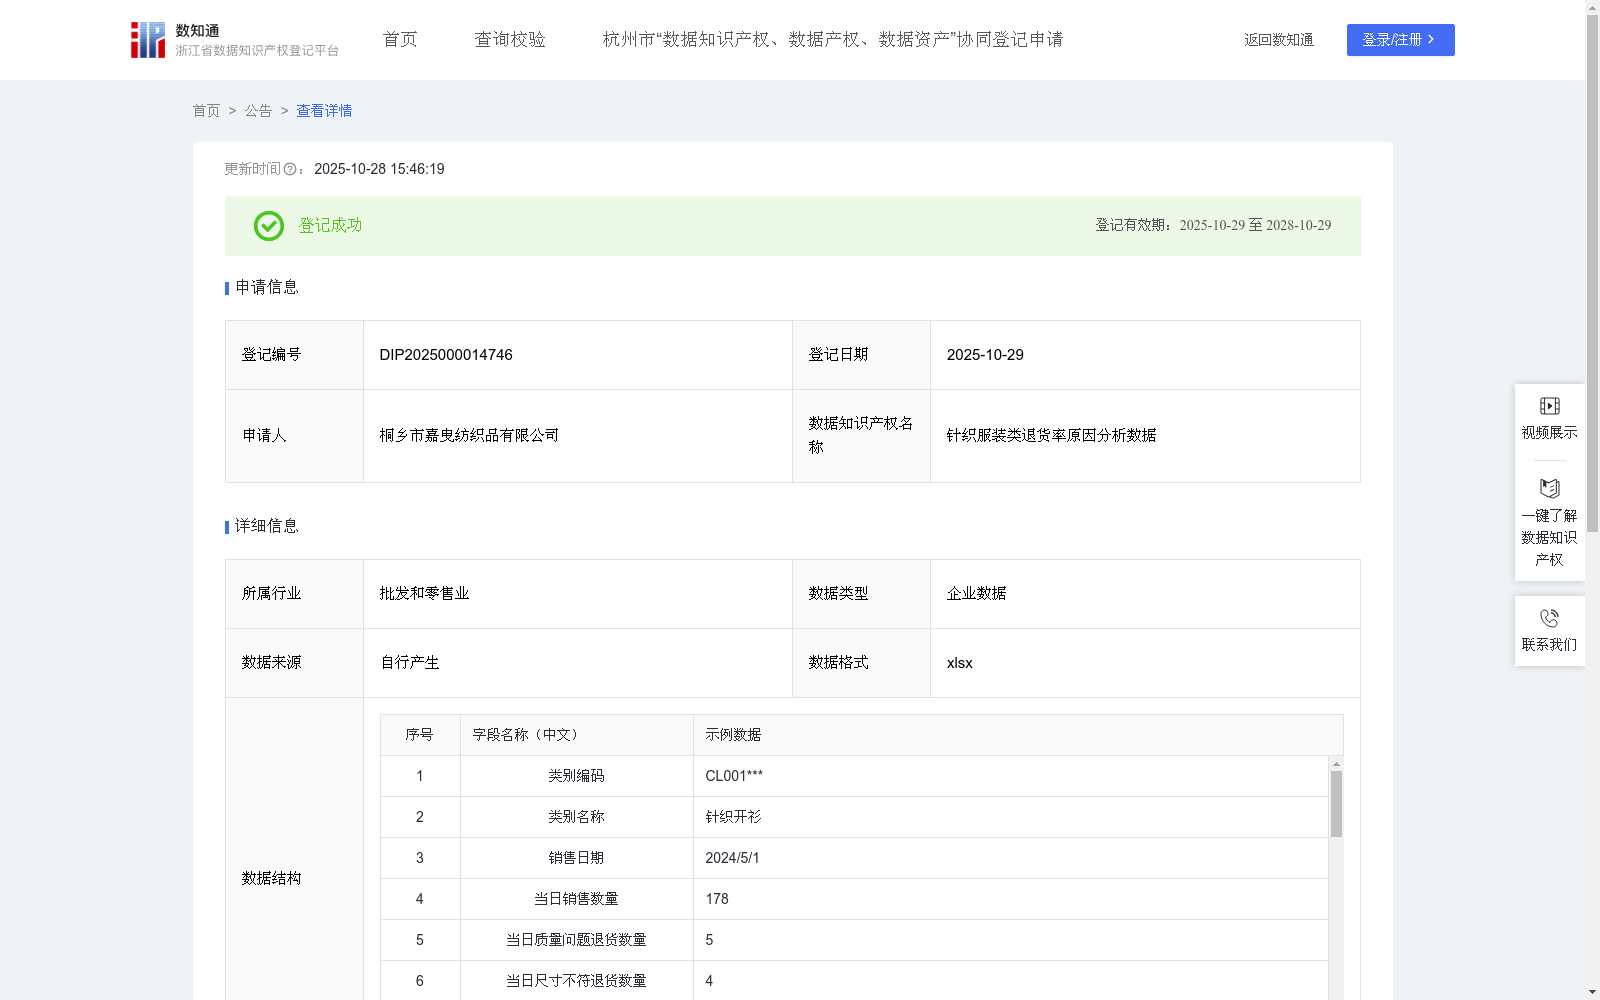
针织服装类退货率原因分析数据
收藏浙江省数据知识产权登记平台2025-10-28 更新2025-10-29 收录
下载链接:
https://www.zjip.org.cn/home/announce/trends/6330436
下载链接
链接失效反馈官方服务:
资源简介:
针织服装类退货率原因分析数据可以帮助企业降低退货率,通过分析不同退货原因的占比,可精准定位产品的核心问题,推动产品改进。针对高占比的退货原因,可提前优化服务流程,减少退货发生。例如:若 “尺寸不符” 是产品的主要退货原因,可在客户咨询时主动推送 “尺码推荐工具”(如输入身高体重自动推荐尺码),或提供 “免费试穿退换” 服务,降低退货率等方式改变经营策略。也可作为跨部门考核的量化指标,明确责任归属更加规范企业运营。同时也可给本地区调整经营策略、进行市场分析和竞争对比时的提供参考依据。综上,退货数量占比的核心价值是将 “退货” 从 “成本损耗” 转化为 “改进信号”,通过数据定位问题根源,推动企业从产品、服务到运营的全链路优化,最终降低退货率、提升客户满意度以及对企业发展助力。1.数据采集: 收集每日销售数据字段:类别编码、类别名称、销售日期、当日销售数量、当日质量问题退货数量、当日尺寸不符退货数量、当日颜色差异退货数量、当日七天无理由退货数量、当日配送损坏退货数量、当日描述不符退货数量等。
2.数据预处理: 对采集的数据进行清洗,去除重复记录,处理缺失值。
3.数据加工与分析:
①计算月度汇总数据:
当月销售数量=∑每日销售数量;
当月X类退货数量=∑每日X类退货数量;
当月退货总数=∑当月所有类别退货数量;
②计算退货原因占比与退货率:
当月X类退货占比= 当月X类退货数量/当月退货总数×100%;
退货率= 月退货总数/当月销售数量×100%;
③识别关键问题:
根据排序,识别当月退货原因占比最高二项;
4.数据应用:退货原因占比最高二项进行预警并改变经营策略如:1.质量问题则说明该产品的生产工艺、原材料或质检流程存在缺陷,需推动生产部门升级工艺、加强质检。2.尺寸不符则可在客户咨询时主动推送 “尺码推荐工具”(如输入身高体重自动推荐尺码),或提供 “免费试穿退换” 服务,降低退货率。且根据经验若当月退货率超过20%需从产品质量、尺码标准、宣传描述、物流包装等多环节排查高占比退货原因,针对性优化并跟踪改进效果。
Data for return rate cause analysis of knitted apparel can help enterprises reduce return rates. By analyzing the proportion of different return causes, enterprises can accurately pinpoint core product issues and drive product improvements. For high-proportion return causes, enterprises can optimize service processes in advance to reduce the occurrence of returns. For example, if "incorrect size" is the main return cause of products, enterprises can proactively push the "size recommendation tool" (such as automatically recommending sizes by entering height and weight) when customers consult, or provide "free trial and return service" to reduce return rates and adjust business strategies. This data can also serve as a quantitative indicator for cross-departmental assessment, clarify responsibility attribution and standardize enterprise operations. Additionally, it can provide reference for local enterprises when adjusting business strategies, conducting market analysis and competitive comparisons.
In summary, the core value of return quantity proportion is to transform "returns" from "cost loss" into "improvement signals". By locating the root causes of problems through data, enterprises can promote end-to-end optimization across products, services and operations, ultimately reducing return rates, improving customer satisfaction and supporting enterprise development.
1. Data Collection: Collect daily sales data with fields including: category code, category name, sales date, daily sales volume, daily return quantity due to quality issues, daily return quantity due to incorrect size, daily return quantity due to color difference, daily 7-day no-reason return quantity, daily return quantity due to damaged delivery, daily return quantity due to inconsistent description, etc.
2. Data Preprocessing: Clean the collected data, remove duplicate records and handle missing values.
3. Data Processing and Analysis:
① Calculate monthly summary data:
Monthly sales volume = ∑ daily sales volume;
Monthly return quantity of category X = ∑ daily return quantity of category X;
Total monthly returns = ∑ monthly return quantities of all categories;
② Calculate return cause proportion and return rate:
Proportion of category X returns in the current month = (Monthly return quantity of category X / Total monthly returns) × 100%;
Return rate = (Total monthly returns / Monthly sales volume) × 100%;
③ Identify key issues: Identify the top two return causes by proportion in the current month based on sorting;
4. Data Application: Issue early warnings for the top two return causes by proportion and adjust business strategies, for example:
1. For quality issues: It indicates defects in the product's production technology, raw materials or quality inspection process, and the production department needs to be urged to upgrade technology and strengthen quality inspection.
2. For incorrect size issues: Proactively push the "size recommendation tool" (such as automatically recommending sizes by entering height and weight) when customers consult, or provide "free trial and return service" to reduce return rates.
According to experience, if the monthly return rate exceeds 20%, it is necessary to investigate high-proportion return causes from multiple links including product quality, size standards, promotional descriptions, logistics packaging, etc., conduct targeted optimization and track improvement effects.
提供机构:
桐乡市嘉曳纺织品有限公司
创建时间:
2025-08-12
搜集汇总
数据集介绍
背景与挑战
背景概述
该数据集聚焦针织服装类产品的退货率分析,包含601条企业数据,每月更新,通过详细记录销售和各类退货原因(如质量问题、尺寸不符)的数量和占比,帮助企业识别核心问题并优化运营策略,从而降低退货率并提升客户满意度。
以上内容由遇见数据集搜集并总结生成


