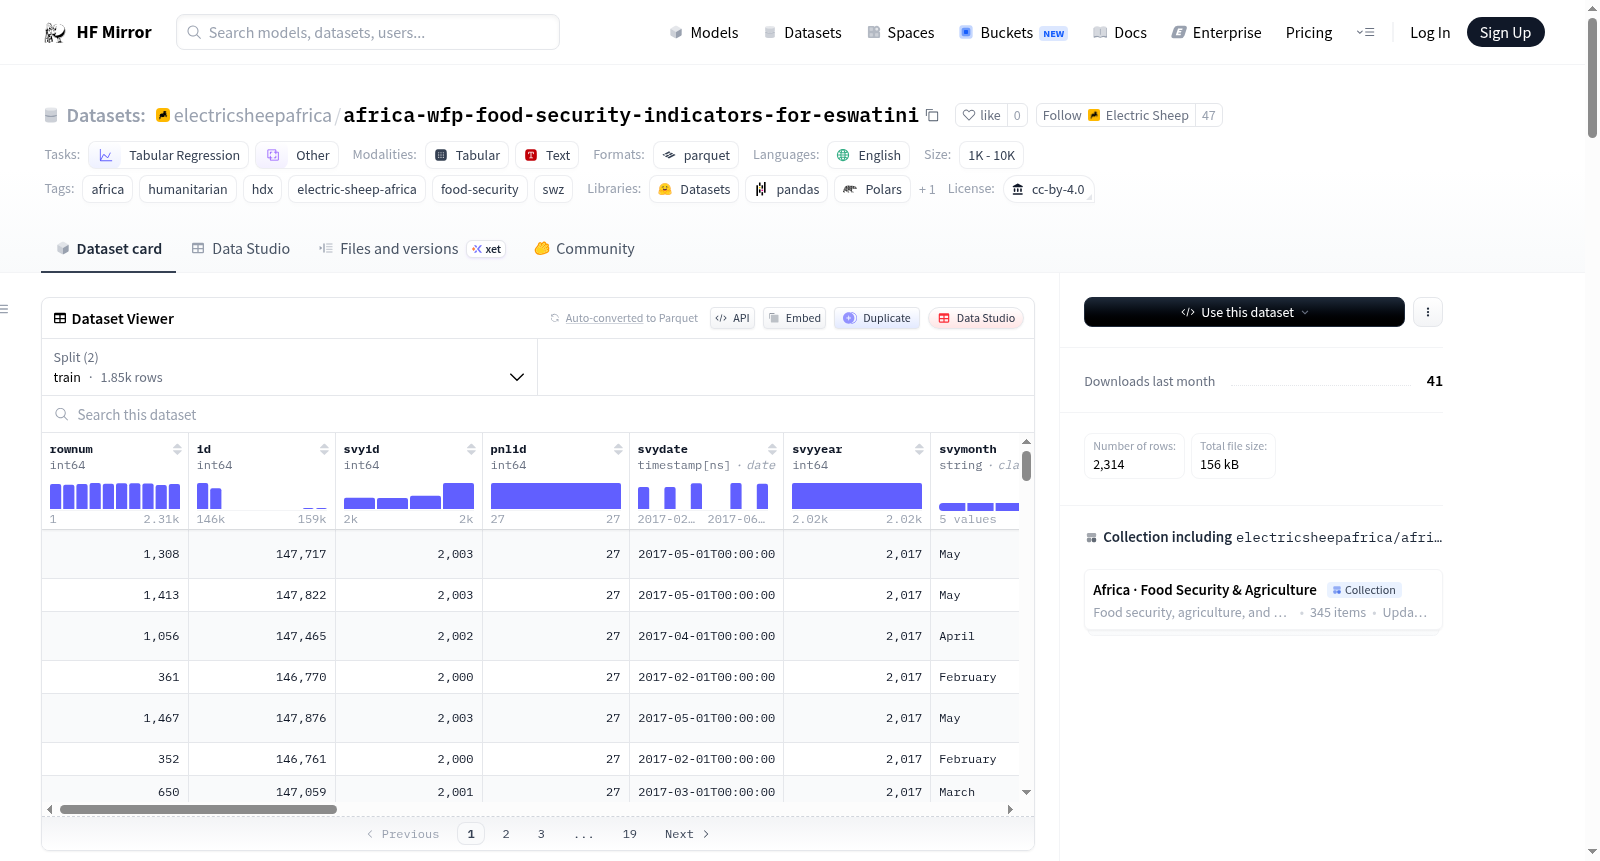
electricsheepafrica/africa-wfp-food-security-indicators-for-eswatini
收藏Hugging Face2026-04-10 更新2026-04-12 收录
下载链接:
https://hf-mirror.com/datasets/electricsheepafrica/africa-wfp-food-security-indicators-for-eswatini
下载链接
链接失效反馈官方服务:
资源简介:
---
annotations_creators:
- no-annotation
language_creators:
- found
language:
- en
license: cc-by-4.0
multilinguality:
- monolingual
size_categories:
- 1K<n<10K
source_datasets:
- original
task_categories:
- tabular-regression
- other
task_ids: []
tags:
- africa
- humanitarian
- hdx
- electric-sheep-africa
- food-security
- swz
pretty_name: "Eswatini - Food Security Indicators"
dataset_info:
splits:
- name: train
num_examples: 1851
- name: test
num_examples: 462
---
# Eswatini - Food Security Indicators
**Publisher:** WFP - World Food Programme · **Source:** [HDX](https://data.humdata.org/dataset/wfp-food-security-indicators-for-eswatini) · **License:** `cc-by-igo` · **Updated:** 2024-09-13
---
## Abstract
The World Food Programme (WFP) launched the mobile Vulnerability Analysis and Mapping (mVAM) project in 2013, beginning in DRC and Somalia. mVAM uses mobile technology to track food security trends in real-time, providing high-frequency data that supports humanitarian decision-making. Data collection methods are tailored to the needs of each country that mVAM operates in. This dataset contains data from the [mVAM databank](http://vam.wfp.org/sites/mvam_monitoring/) covering various indicators (one per resource).
Each row in this dataset represents time-series observations. Temporal coverage is indicated by the `svydate` column(s). Geographic scope: **SWZ**.
*Curated into ML-ready Parquet format by [Electric Sheep Africa](https://huggingface.co/electricsheepafrica).*
---
## Dataset Characteristics
| | |
|---|---|
| **Domain** | Food security and nutrition |
| **Unit of observation** | Time-series observations |
| **Rows (total)** | 2,314 |
| **Columns** | 22 (12 numeric, 9 categorical, 1 datetime) |
| **Train split** | 1,851 rows |
| **Test split** | 462 rows |
| **Geographic scope** | SWZ |
| **Publisher** | WFP - World Food Programme |
| **HDX last updated** | 2024-09-13 |
---
## Variables
**Geographic** — `svyid` (range 2000.0–2004.0), `svydate`, `svyyear` (range 2017.0–2017.0), `svymonth` (April, May, June), `svymonthnum` (range 2.0–6.0) and 1 others.
**Identifier / Metadata** — `id` (range 146398.0–158970.0), `pnlid` (range 27.0–27.0), `adm0_name` (Swaziland), `adm0_code` (range 235.0–235.0), `esa_source` (HDX) and 1 others.
**Other** — `rownum` (range 1.0–2314.0), `indpvars` (AdminUnits, WallType, HoHSex), `variable` (rCSI, FCG==1, FCG==2), `demographic` (F, M, Cement), `numobs` (range 55.0–1817.0) and 5 others.
---
## Quick Start
```python
from datasets import load_dataset
ds = load_dataset("electricsheepafrica/africa-wfp-food-security-indicators-for-eswatini")
train = ds["train"].to_pandas()
test = ds["test"].to_pandas()
print(train.shape)
train.head()
```
---
## Schema
| Column | Type | Null % | Range / Sample Values |
|---|---|---|---|
| `rownum` | int64 | 0.0% | 1.0 – 2314.0 (mean 1157.5) |
| `id` | int64 | 0.0% | 146398.0 – 158970.0 (mean 147904.3902) |
| `svyid` | int64 | 0.0% | 2000.0 – 2004.0 (mean 2002.0882) |
| `pnlid` | int64 | 0.0% | 27.0 – 27.0 (mean 27.0) |
| `svydate` | datetime64[ns] | 0.0% | |
| `svyyear` | int64 | 0.0% | 2017.0 – 2017.0 (mean 2017.0) |
| `svymonth` | object | 0.0% | April, May, June |
| `svymonthnum` | int64 | 0.0% | 2.0 – 6.0 (mean 4.0882) |
| `adm0_name` | object | 0.0% | Swaziland |
| `indpvars` | object | 0.0% | AdminUnits, WallType, HoHSex |
| `variable` | object | 0.0% | rCSI, FCG==1, FCG==2 |
| `adminstrata` | object | 63.3% | Hhohho, Lubombo, Manzini |
| `demographic` | object | 36.7% | F, M, Cement |
| `numobs` | int64 | 0.0% | 55.0 – 1817.0 (mean 615.5691) |
| `mean` | float64 | 0.0% | 0.0 – 61.5088 (mean 3.8196) |
| `stdev` | float64 | 0.1% | 0.0163 – 58.5356 (mean 2.9222) |
| `cnfintvhi` | float64 | 0.0% | 0.0115 – 64.5734 (mean 3.9353) |
| `cnfintvlo` | float64 | 0.0% | 0.0 – 59.4775 (mean 3.706) |
| `adm0_code` | float64 | 0.0% | 235.0 – 235.0 (mean 235.0) |
| `variabledescription` | object | 55.4% | prevalence-->equals to 1 if household uses this strategy 1 or more times per week, prevalence-->food consumption group = poor+borderline, prevalence-->food consumption group = poor |
| `esa_source` | object | 0.0% | HDX |
| `esa_processed` | object | 0.0% | 2026-04-10 |
---
## Numeric Summary
| Column | Min | Max | Mean | Median |
|---|---|---|---|---|
| `rownum` | 1.0 | 2314.0 | 1157.5 | 1157.5 |
| `id` | 146398.0 | 158970.0 | 147904.3902 | 147566.5 |
| `svyid` | 2000.0 | 2004.0 | 2002.0882 | 2002.0 |
| `pnlid` | 27.0 | 27.0 | 27.0 | 27.0 |
| `svyyear` | 2017.0 | 2017.0 | 2017.0 | 2017.0 |
| `svymonthnum` | 2.0 | 6.0 | 4.0882 | 4.0 |
| `numobs` | 55.0 | 1817.0 | 615.5691 | 448.0 |
| `mean` | 0.0 | 61.5088 | 3.8196 | 0.4074 |
| `stdev` | 0.0163 | 58.5356 | 2.9222 | 0.4554 |
| `cnfintvhi` | 0.0115 | 64.5734 | 3.9353 | 0.4547 |
| `cnfintvlo` | 0.0 | 59.4775 | 3.706 | 0.3585 |
| `adm0_code` | 235.0 | 235.0 | 235.0 | 235.0 |
---
## Curation
Raw data was downloaded from HDX via the CKAN API and converted to Parquet. Column names were lowercased and standardised to snake_case. Common missing-value markers (`N/A`, `null`, `none`, `-`, `unknown`, `no data`, `#N/A`) were unified to `NaN`. 8 column(s) with >80% missing values were removed: `adm1_name`, `adm2_name`, `median`, `pctl5`, `pctl25`, `pctl75`.... 1 column(s) were cast from string to numeric or datetime based on parse-success rate (>85% threshold). The dataset was split 80/20 into train and test partitions using a fixed random seed (42) and saved as Snappy-compressed Parquet.
---
## Limitations
- Data originates from WFP - World Food Programme and has not been independently validated by ESA.
- Automated cleaning cannot correct for misreported values, definitional inconsistencies, or sampling bias in the original collection.
- The following columns have >20% missing values and should be treated with caution in modelling: `adminstrata`, `demographic`, `variabledescription`.
- Refer to the [original HDX dataset page](https://data.humdata.org/dataset/wfp-food-security-indicators-for-eswatini) for the publisher's own methodology notes and caveats.
---
## Citation
```bibtex
@dataset{hdx_africa_wfp_food_security_indicators_for_eswatini,
title = {Eswatini - Food Security Indicators},
author = {WFP - World Food Programme},
year = {2024},
url = {https://data.humdata.org/dataset/wfp-food-security-indicators-for-eswatini},
note = {Repackaged for machine learning by Electric Sheep Africa (https://huggingface.co/electricsheepafrica)}
}
```
---
*[Electric Sheep Africa](https://huggingface.co/electricsheepafrica) — Africa's ML dataset infrastructure. Lagos, Nigeria.*
提供机构:
electricsheepafrica
搜集汇总
数据集介绍
构建方式
在粮食安全监测领域,实时数据对于人道主义决策至关重要。本数据集源自世界粮食计划署的移动脆弱性与制图项目,该项目自2013年起利用移动技术收集高频数据。原始数据通过HDX平台获取,经过Electric Sheep Africa团队的精心整理,统一了缺失值标记并移除了高缺失率字段,最终转换为适合机器学习处理的Parquet格式,并按照80:20的比例划分为训练集与测试集。
特点
该数据集聚焦于斯威士兰的粮食安全指标,涵盖2314条时间序列观测记录,包含22个特征变量,其中12个为数值型、9个为分类型、1个为日期时间型。数据时间跨度集中于2017年,空间范围限定于斯威士兰国内,提供了如rCSI、FCG等关键粮食安全指标的统计量,包括均值、标准差及置信区间,为区域粮食安全态势分析提供了结构化基础。
使用方法
研究人员可通过Hugging Face的datasets库直接加载数据集,利用Python环境进行数据探索与模型构建。数据集已预分为训练集与测试集,可直接转换为Pandas DataFrame进行后续分析。鉴于部分字段存在较高缺失率,建议在建模前谨慎处理缺失数据,并参考原始发布方的方法论说明以确保分析结果的可靠性。
背景与挑战
背景概述
在粮食安全监测领域,高频、实时的数据对于人道主义决策至关重要。世界粮食计划署于2013年启动了移动脆弱性与制图项目,旨在利用移动技术追踪粮食安全趋势。该数据集由世界粮食计划署发布,并由Electric Sheep Africa于2024年重新整理,专注于埃斯瓦蒂尼地区的粮食安全指标,涵盖时间序列观测数据,核心研究问题在于通过量化指标动态评估区域粮食安全状况,为政策制定提供数据支撑。
当前挑战
该数据集致力于解决粮食安全评估中的时序预测与回归分析挑战,涉及指标如rCSI和FCG的精准建模。构建过程中,原始数据存在显著缺失值,例如adminstrata和demographic列缺失率超过20%,且部分列因高缺失率被移除。数据清洗虽统一了缺失标记,但无法修正原始收集中的报告偏差或定义不一致问题,这为模型可靠性带来潜在风险。
常用场景
经典使用场景
在粮食安全监测领域,该数据集为研究人员提供了斯威士兰地区高频时间序列观测数据,涵盖rCSI、FCG等关键指标。其经典使用场景在于构建回归模型,预测特定人口群体或行政区域的粮食不安全风险。通过分析变量如家庭应对策略指数和食物消费分组,模型能够捕捉季节性波动与地域差异,为早期预警系统提供量化依据。
解决学术问题
该数据集有效解决了人道主义研究中实时数据稀缺的难题,使学者能够检验粮食不安全驱动因素的理论假设。它支持对脆弱性映射方法的验证,促进统计推断与因果分析,例如探究社会经济变量与营养指标间的动态关联。其结构化格式降低了跨学科研究的门槛,推动了发展经济学与公共健康领域的实证创新。
衍生相关工作
围绕该数据集衍生的经典工作包括基于机器学习的粮食安全预测框架,如使用梯度提升树模型估计区域风险等级。相关研究扩展至多国比较分析,探索气候冲击与市场波动对粮食体系的连锁影响。此外,学者将其与遥感数据融合,开发出空间显式脆弱性图谱,为区域可持续发展目标监测提供了方法论范例。
以上内容由遇见数据集搜集并总结生成


