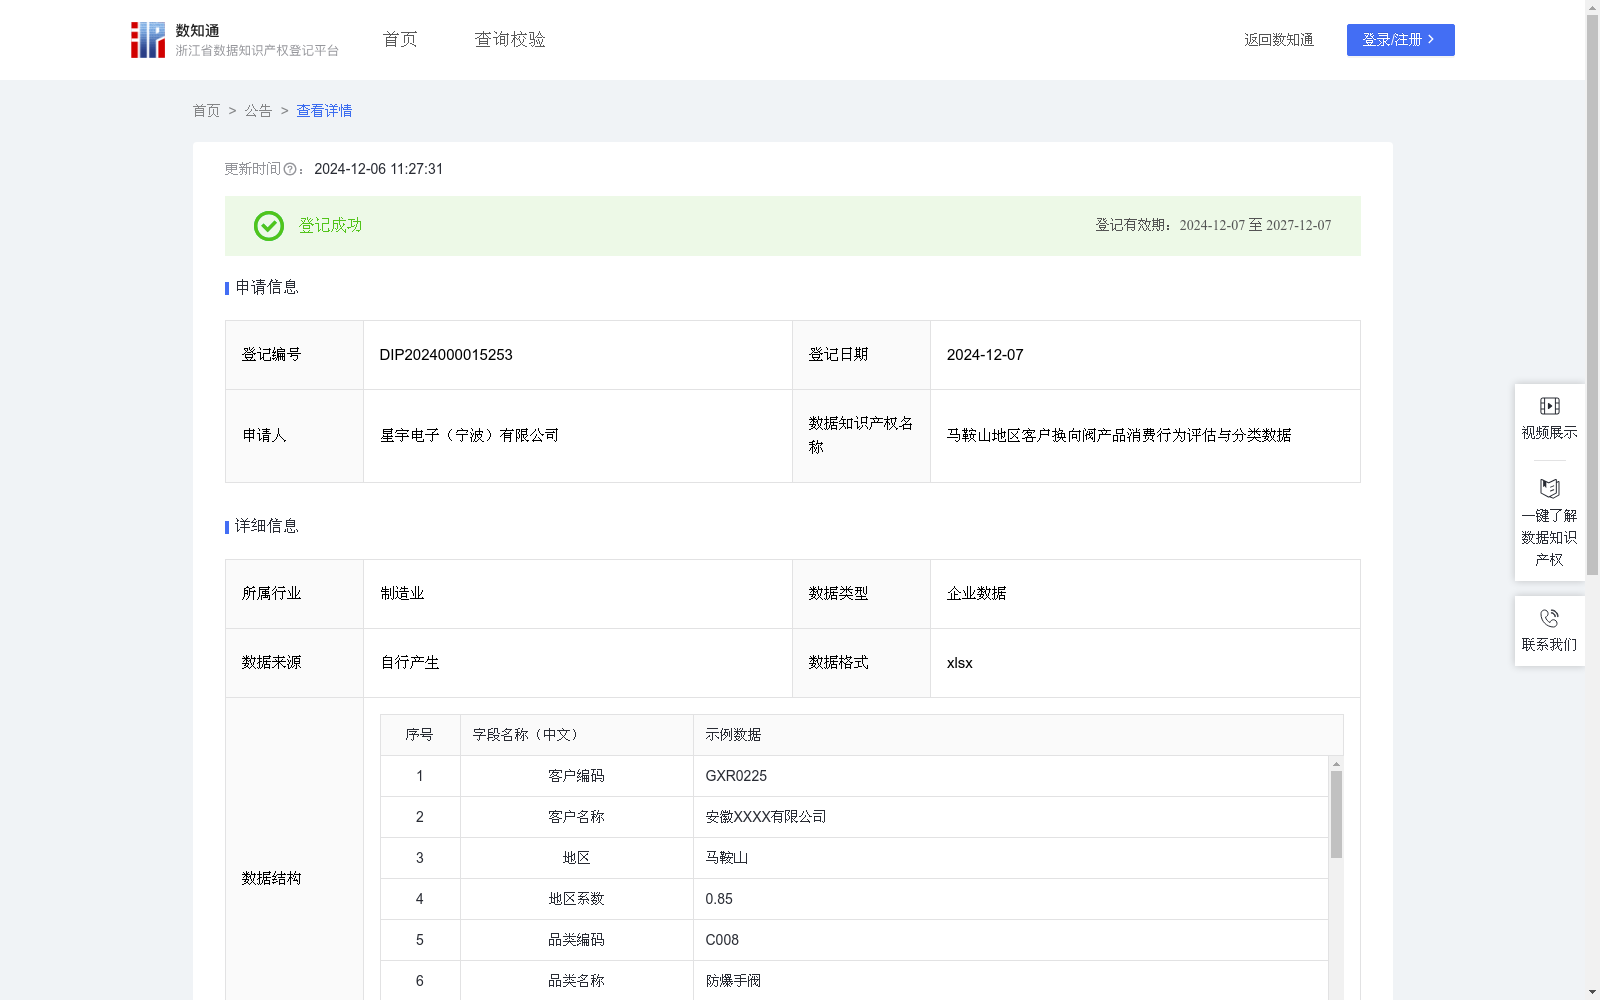
马鞍山地区客户换向阀产品消费行为评估与分类数据
收藏资源简介:
通过收集和分析马鞍山市地区客户对换向阀产品的需求量、消费相关数据,了解客户对换向阀产品需求量的购买力水平和消费偏好,为本行业的所有企业提供依据。通过将客户等级划分为“高、中、低”有助于更好的梳理客户,高等级客户可以获得定制化优惠和专属服务,增强忠诚度;中等级客户则通过定期促销和产品教育,促进其向高等级转化;低等级客户通过基础维护和再激活活动,降低流失风险。分级管理有助于推动产品开发与优化,实现精准的市场细分与定位,进行有效的风险管理与流失预测,并建立战略合作关系。1.数据采集:采集马鞍山市地区客户对换向阀产品的相关交易数据。2.数据处理:对采集到的数据进行分类、合并、累加,1)计算比值指标:最小数量金额比 = 单笔最少订单数量/单笔最少消费额度;最大数量金额比 = 单笔最高订单数量/单笔最高消费额度;平均数量金额比 = 平均订单数量/平均消费额度。2)标准化处理,使用 MinMaxScaler 将最小数量金额比、最大数量金额比、平均数量金额比标准化至 [0, 1] 范围内,得到标准化最小比、标准化最大比、标准化平均比。3)需求量分析:需求量指数P = (w1×标准化最小比+ w2×标准化最大比+ w3×标准化平均比) × K × 地区系数,其中:w1 = 0.4(最小比权重)、w2 = 0.3(最大比权重)、w3 = 0.3(平均比权重)、K = 0.9(固定消费系数)、地区系数 = 0.85(马鞍山市)。3.数据分类分级:根据计算出的需求量指数P,将客户等级划分为“高、中、低”。
By collecting and analyzing data on customer demand for directional control valves and related consumption data in the Ma'anshan City area, this dataset aims to understand the purchasing power and consumption preferences of customers regarding directional control valves, providing a reliable basis for all enterprises in the industry. Tiering customers into "high, medium, and low" tiers helps better organize customer groups: high-tier customers can enjoy customized discounts and exclusive services to enhance their loyalty; medium-tier customers are guided to upgrade to high tiers through regular promotions and product education; low-tier customers are provided with basic maintenance and reactivation campaigns to reduce churn risk. Tiered customer management facilitates product development and optimization, enables precise market segmentation and positioning, supports effective risk management and churn prediction, and fosters strategic cooperative partnerships. 1. Data Collection Collect relevant transaction data of customers in Ma'anshan City regarding directional control valve products. 2. Data Processing Process the collected data through classification, merging, and accumulation: 1) Calculate ratio indicators: - Minimum quantity-to-amount ratio = minimum order quantity per transaction / minimum consumption amount per transaction - Maximum quantity-to-amount ratio = maximum order quantity per transaction / maximum consumption amount per transaction - Average quantity-to-amount ratio = average order quantity / average consumption amount 2) Standardization: Use MinMaxScaler to standardize the three ratio indicators (minimum, maximum, and average quantity-to-amount ratios) to the range of [0, 1], yielding standardized minimum ratio, standardized maximum ratio, and standardized average ratio. 3) Demand index analysis: The demand index P is calculated as: P = (w1 × standardized minimum ratio + w2 × standardized maximum ratio + w3 × standardized average ratio) × K × regional coefficient Where: w1 = 0.4 (weight of minimum ratio), w2 = 0.3 (weight of maximum ratio), w3 = 0.3 (weight of average ratio), K = 0.9 (fixed consumption coefficient), regional coefficient = 0.85 (for Ma'anshan City). 3. Data Classification and Tiering Divide customers into "high, medium, and low" tiers based on the calculated demand index P.