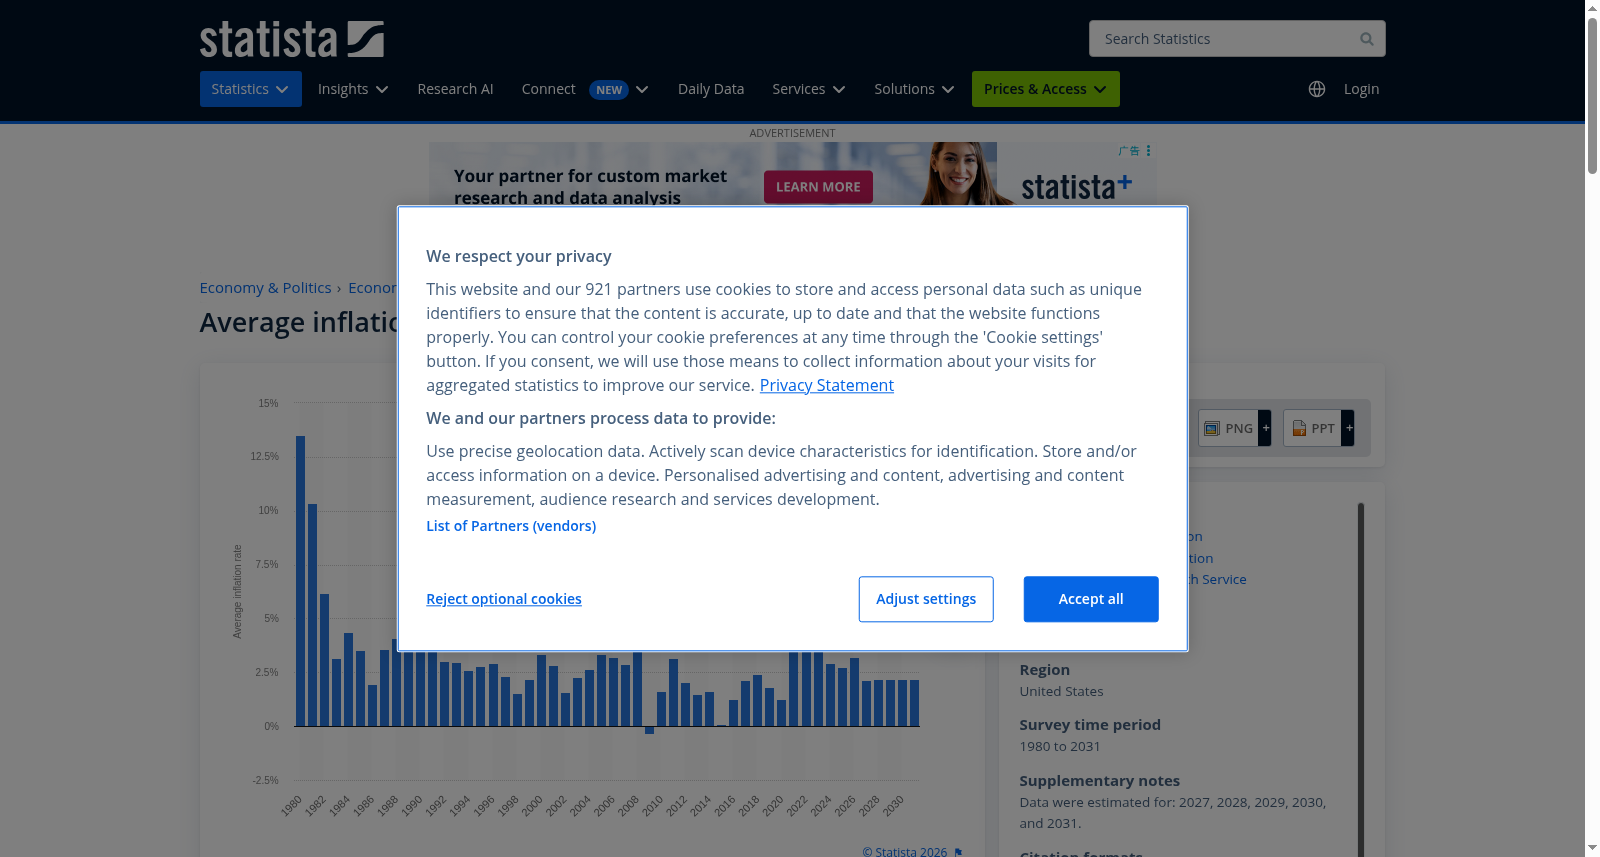
Projected annual inflation rate in the United States 2010-2027
收藏www.statista.com2025-03-22 收录
下载链接:
https://www.statista.com/statistics/244983/projected-inflation-rate-in-the-united-states/
下载链接
链接失效反馈官方服务:
资源简介:
This statistic shows the annual inflation rate in the U.S. from 2010 to 2021 with additional projections up to 2027. The data represents U.S. city averages. The base period was 1982-84. In economics, the inflation rate is a measurement of inflation, the rate of increase of a price index (in this case: consumer price index). It is the percentage rate of change in prices level over time. The rate of decrease in the purchasing power of money is approximately equal. According to the forecast, prices will increase by 7.68 percent in 2022.The annual inflation rate for previous years can be found here and the consumer price index for all urban consumers here.The monthly inflation rate for the United States can also be accessed here.Inflation in the U.S.Inflation is a term used to describe a general rise in the price of goods and services in an economy over a given period of time. Inflation in the United States is calculated using the consumer price index (CPI). The consumer price index is a measure of change in the price level of a preselected market basket of consumer goods and services purchased by households. This forecast of U.S. inflation was prepared by the International Monetary Fund. They project a spike in the inflation rate for 2022, followed by a decrease to around roughly two percent annual rise in the general level of prices until 2027. This means that a product bought today for about 100 U.S. dollars will cost about 107.68 U.S. dollars next year, and so on. Considering the annual inflation rate in the United States in 2021, a two percent inflation rate is a very moderate projection. The current spike in inflation in the United States and worldwide is being attributed to the re-opening of economies as the COVID-19 pandemic wanes, the disruption of supply chains due to the war in Ukraine, and pandemic related changes in the labor force. Although the moderate inflation of prices between two and three percent is considered normal in a modern economy, countries’ central banks try to prevent severe inflation and deflation to keep the growth of prices to a minimum. Severe inflation is considered dangerous to a country’s economy because it can rapidly diminish the population’s purchasing power and thus damage the GDP .
本统计数据展示了2010年至2021年美国年度通货膨胀率,并附加了对2027年的预测。数据代表美国城市平均水平。基期设定为1982至1984年。在经济学领域,通货膨胀率是衡量通货膨胀的指标,即价格指数(在本例中为消费者价格指数)增长率的度量。它是价格水平随时间变化的百分比变化率。货币购买力下降的比率与之大致相等。根据预测,2022年价格将上升7.68%。过往年度的年度通货膨胀率可在此找到,而所有城市消费者的消费者价格指数可在此查询。美国每月的通货膨胀率亦可通过此处获取。美国通货膨胀的概述通货膨胀是指在一定时期内,一个经济体中商品和服务价格普遍上涨的现象。美国的通货膨胀率计算采用消费者价格指数(CPI)。消费者价格指数是衡量预选消费品和服务市场篮子价格水平变化的指标,由家庭购买。此份关于美国通货膨胀的预测由国际货币基金组织编制。他们预测2022年通货膨胀率将激增,随后降至约每年2%的价格水平增长,直至2027年。这意味着,今天以约100美元购买的产品,明年将花费约107.68美元,依此类推。考虑到2021年美国的年度通货膨胀率,2%的通货膨胀率被视为一个非常温和的预测。目前美国及全球通货膨胀的激增,归因于新冠疫情逐渐消退后经济的重新开放,乌克兰战争导致的供应链中断,以及与疫情相关的劳动力市场变化。尽管在现代经济中,2%至3%的价格温和通货膨胀被认为是正常的,但各国中央银行试图防止严重的通货膨胀和通货紧缩,以将价格上涨控制在最低限度。严重的通货膨胀被认为对国家经济构成危险,因为它可以迅速降低民众的购买力,从而损害GDP。
提供机构:
Statista
搜集汇总
数据集介绍
背景与挑战
背景概述
该数据集提供了美国从1980年至2031年的年平均通胀率数据,其中包含历史记录(如2022年为7.99%)和未来预测(如2027年为2.14%)。数据基于消费者价格指数计算,并注明2027年至2031年的值为估计值,反映了通胀率长期波动下降的趋势。
以上内容由遇见数据集搜集并总结生成


