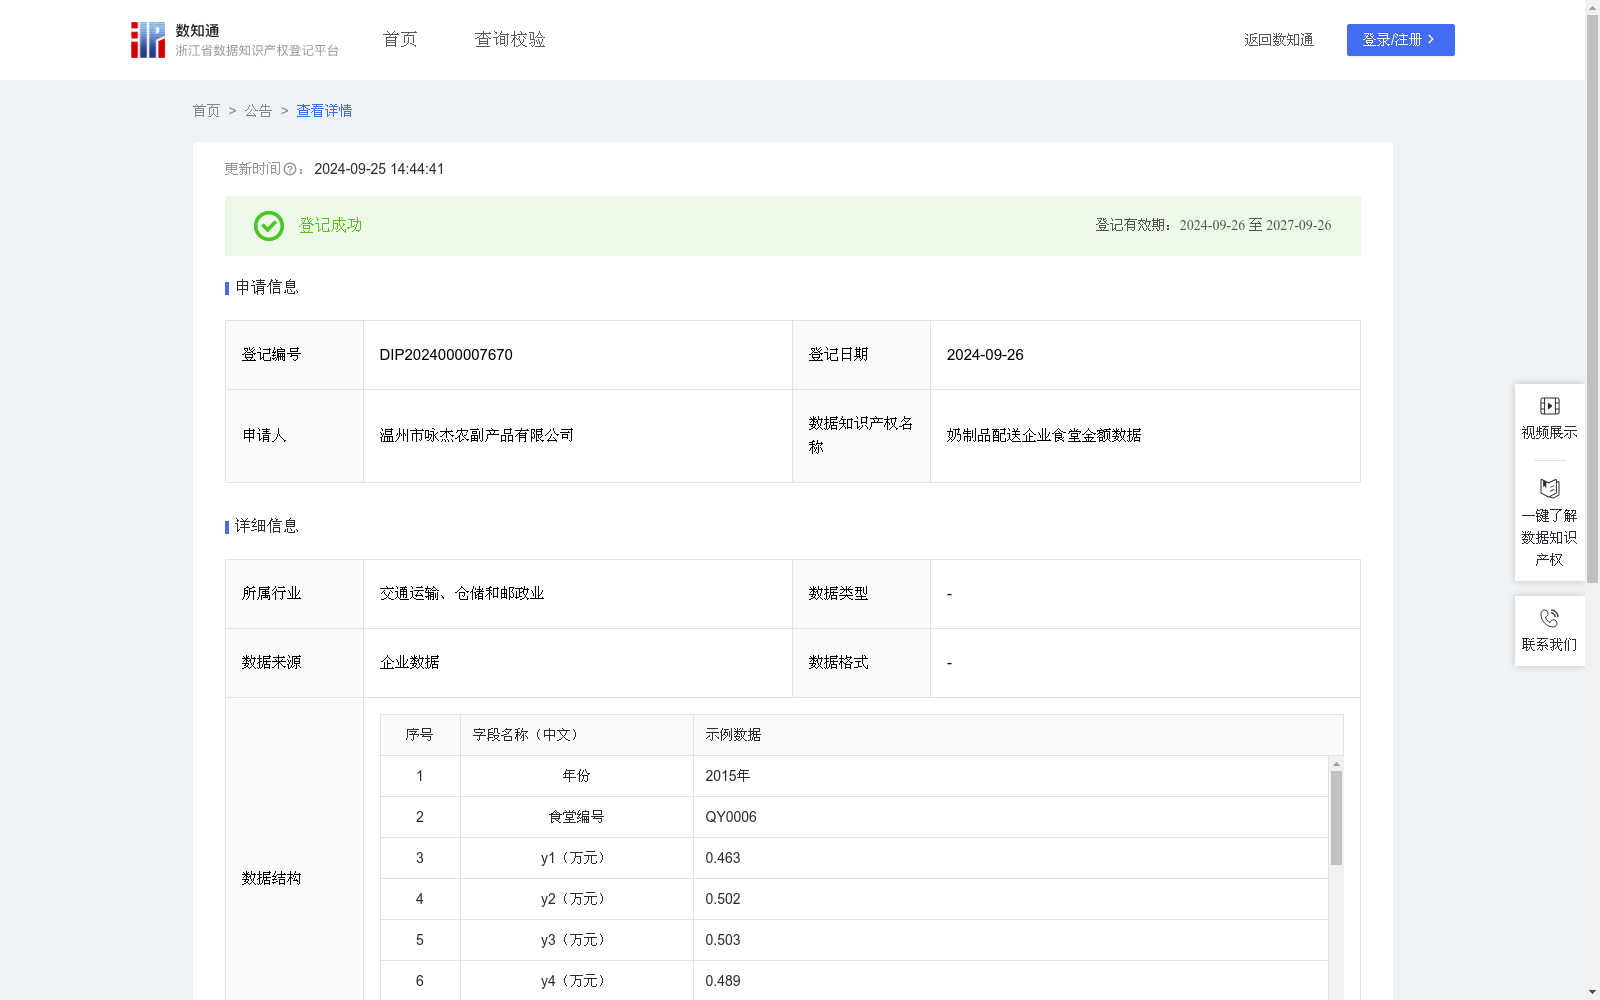
奶制品配送企业食堂金额数据
收藏浙江省数据知识产权登记平台2024-09-25 更新2024-09-26 收录
下载链接:
https://www.zjip.org.cn/home/announce/trends/65017
下载链接
链接失效反馈官方服务:
资源简介:
通过配送管理系统软件采集本公司奶制品配送企业食堂订单信息,将不同的配送订单以各企业食堂来划分,从而计算各个企业食堂每个月的配送金额数据,再计算出每年配送金额的方差大小,方差大小用来评价各个企业食堂的配送情况,从而用于评估所有企业食堂的采购和配送策略,所有配送企业可以通过该数据了解奶制品在不同企业食堂的配送行情,以平衡采购和配送奶制品数量。对于超平稳型食堂,所有配送企业无需时时关注该企业食堂的行情,可每月保持好奶制品的采购和配送数量;对于一般平稳型食堂,所有配送企业需每季度关注该企业食堂的行情,适当调整奶制品的采购和配送数量;而对于波动型食堂,所有配送企业需每月时时关注该企业食堂行情,了解该企业食堂的配送行情变化,以适应大幅度调整奶制品的采购和配送数量变化。步骤1:通过配送管理系统软件采集本公司奶制品配送企业食堂的订单信息,将不同的配送订单以各企业食堂来划分归类,从而将各年度每个月配送至企业食堂的金额,从一月至十二月依次用y1,y2...y12表示,并汇总计算得到各个企业食堂当年的总配送金额y。步骤2:计算各企业食堂的月平均配送金额y̅=各个企业食堂当年的总配送金额y/12。步骤3:根据方差公式计算方差S^2={(y1-y̅)^2+(y2-y̅)^2+(y3-y̅)^2+…+(y12-y̅)^2}/12,从而得到各个企业食堂的配送金额的方差S^2大小。步骤4:当方差S^2小于0.003评价该企业食堂为超平稳型食堂。当方差S^2大于等于0.003并且小于等于0.006评价该企业食堂为一般平稳型食堂。当方差S^2大于0.006评价该企业食堂为波动型食堂。
This dataset collects order information of dairy product delivery to enterprise canteens of our company via the delivery management system software. Different delivery orders are classified and grouped by their respective enterprise canteens, so as to calculate the monthly delivery amount data of each enterprise canteen, then compute the annual variance of the delivery amounts. The variance value is used to evaluate the delivery performance of each enterprise canteen, thereby supporting the evaluation of procurement and delivery strategies for all enterprise canteens. All delivery enterprises can utilize this dataset to understand the delivery trends of dairy products across different enterprise canteens, so as to balance the quantities of dairy products purchased and delivered.
For ultra-stable canteens, all delivery enterprises do not need to closely monitor their trends on a real-time basis, and can maintain consistent quantities of dairy products purchased and delivered each month; For generally stable canteens, all delivery enterprises need to monitor their trends every quarter and make appropriate adjustments to the quantities of dairy products purchased and delivered; For volatile canteens, all delivery enterprises need to closely monitor their trends on a real-time basis every month to track changes in their delivery conditions, so as to accommodate large-scale adjustments in the quantities of dairy products purchased and delivered.
Step 1: Collect order information of dairy product delivery to enterprise canteens of our company via the delivery management system software, classify and group different delivery orders by their respective enterprise canteens. Denote the monthly delivery amounts to the enterprise canteens in a given year as y₁, y₂, ..., y₁₂ from January to December sequentially, and calculate the total annual delivery amount y of each enterprise canteen through summation.
Step 2: Calculate the monthly average delivery amount ȳ of each enterprise canteen, where ȳ = total annual delivery amount y of the enterprise canteen / 12.
Step 3: Calculate the variance S² using the variance formula: S² = [(y₁-ȳ)² + (y₂-ȳ)² + (y₃-ȳ)² + … + (y₁₂-ȳ)²]/12, thereby obtaining the variance S² of the delivery amounts for each enterprise canteen.
Step 4: Classify an enterprise canteen as ultra-stable if its variance S² is less than 0.003; classify it as generally stable if its variance S² is greater than or equal to 0.003 and less than or equal to 0.006; classify it as volatile if its variance S² is greater than 0.006.
提供机构:
温州市咏杰农副产品有限公司
创建时间:
2024-09-03
搜集汇总
数据集介绍
以上内容由遇见数据集搜集并总结生成


