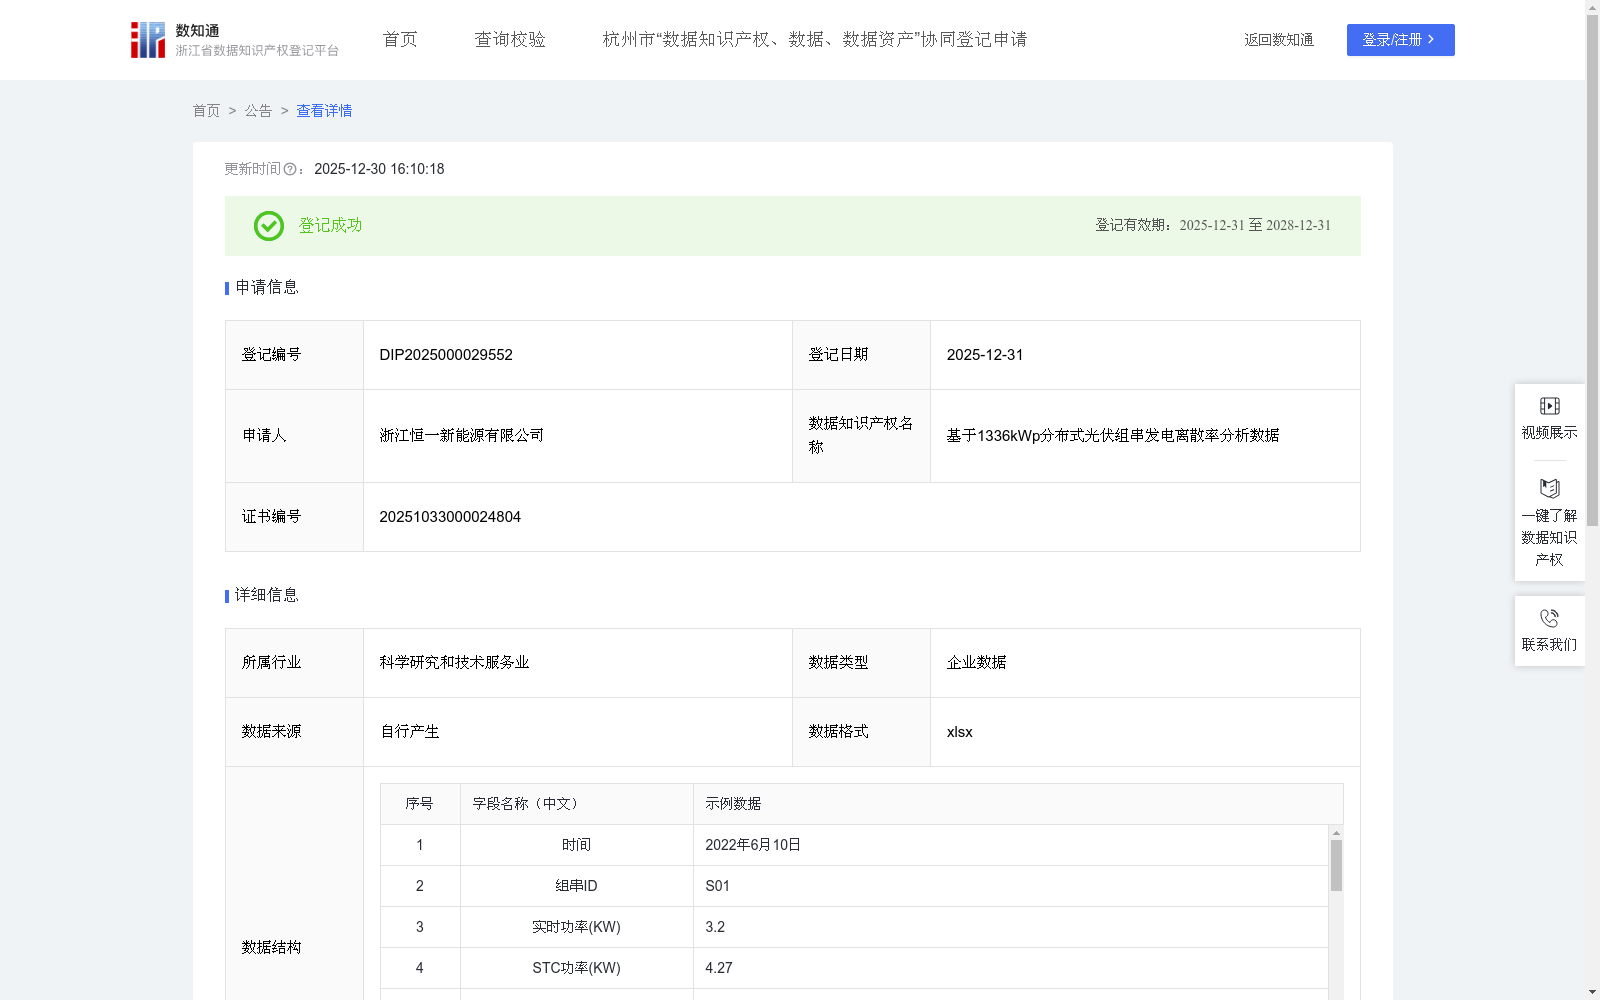
基于1336kWp分布式光伏组串发电离散率分析数据
收藏资源简介:
不同的光伏容量容量参数直接定义了数据所反映的系统规模边界,是理解数据复杂性和分析挑战性的首要技术指标。不同规模电站的离散率特征、成因及优化方案可能有显著差异。容量是解释离散率数据统计特性、异常模式多样性以及环境因素影响程度的核心背景参数。分析不同规模系统的离散率数据,有助于建立规模效应模型。通过分析不同批次、不同型号组件在真实电站中的离散率,可以精准定位哪些产品系列性能更稳定、衰减更一致。发现产品在设计或制造工艺上的潜在缺陷,为下一代产品的研发和现有产品的改进提供数据支撑。定位“短板”组件: 离散率分析能快速识别出性能远低于阵列平均水平的“短板”组件、热斑、遮挡或故障支路,指导运维团队进行精准维修,避免“大海捞针”,极大提升运维效率。驱动运维市场从“故障响应”转向 “一致性保障服务”,淘汰技术落后服务商,倒逼行业研发智能诊断机器人、AI优化算法等新技术,整体提升中国光伏电站年发电效率。行业价值定位:以数据知识产权为核心,驱动金融普惠化、运维智能化、制造高端化的行业基础设施,奠定中国光伏高质量发展新范式。通过公司自有智慧光伏能源管理平台,实时采集各光伏电站组串的发电功率(单位:kW)。 预处理:随机采集一天内对同一时间戳 t 下,区域内 N 个组串发电的实时功率分别为 P1, P2, P3, ..., Pn (对应字段里相应组窜的各个实时功率)进行有效性清洗(剔除通信中断、明显错误等异常数据)。 核心算法:离散率计算: 采用统计学中最常用的变异系数(Coefficient of Variation, CV) 来衡量离散程度,消除数据平均值本身大小对离散程度比较的影响。 步骤1:将实际功率转换至标准条件(STC: 1000W/m², 25℃) 计算公式如下:STC功率 =实时功率/{(辐照度 / 1000) * [1-0.004 * (组件温度-25)]}。分别转化成对应的STC功率为: S1, S2, S3, ..., Sn。 STC功率均值 = (S1 + S2 + ... + Sn) / N 步骤2:计算离散率(变异系数CV) 计算公式如下:离散率 = (标准差 / STC功率均值) * 100。 步骤3:标记异常组串(低于均值12%判定为异常,高于或等于12%判定为正常)
Different photovoltaic capacity parameters directly define the system scale boundaries reflected by the dataset, and serve as the primary technical indicator for understanding data complexity and analytical challenges. The dispersion characteristics, causes and optimization schemes of power stations with different scales may vary significantly. Capacity is the core background parameter for interpreting the statistical characteristics of dispersion data, the diversity of abnormal patterns, and the impact degree of environmental factors. Analyzing dispersion data of systems with different scales helps establish scale effect models. By analyzing the dispersion rates of modules from different batches and models in real-world power stations, we can accurately identify which product series have more stable performance and more consistent power degradation. We can detect potential defects in product design or manufacturing processes, providing data support for the R&D of next-generation products and the improvement of existing products. Identify "weak-link" modules: Dispersion analysis can quickly identify "weak-link" modules with performance far below the array average, as well as hot spots, shading or faulty branches, guiding operation and maintenance (O&M) teams to conduct targeted repairs and avoid "needle in a haystack" searches, greatly improving O&M efficiency. Drive the O&M market to shift from "fault response" to "consistency guarantee services", eliminate technically backward service providers, and push the industry to develop new technologies such as intelligent diagnostic robots and AI optimization algorithms, thus overall improving the annual power generation efficiency of Chinese photovoltaic power stations. Industry value positioning: Taking data intellectual property rights as the core, build industry infrastructure that drives financial inclusion, intelligent O&M and high-end manufacturing, and lay a new paradigm for the high-quality development of China's photovoltaic industry. Generated power (unit: kW) of each photovoltaic string in power stations is collected in real time via the company's proprietary intelligent photovoltaic energy management platform. Preprocessing: Randomly sample the real-time generated power of N strings in the region at the same timestamp t within a day, which are P1, P2, P3, ..., Pn (corresponding to the real-time generated power of each string in the respective fields), and perform validity cleaning to remove abnormal data such as communication interruptions and obvious errors. Core Algorithm: Dispersion Rate Calculation: The most commonly used Coefficient of Variation (CV) in statistics is adopted to measure the degree of dispersion, eliminating the impact of the average value magnitude on dispersion comparison. Step 1: Convert actual power to Standard Test Conditions (STC: 1000W/m², 25℃). The calculation formula is as follows: STC Power = Real-time Power / {(Irradiance / 1000) * [1 - 0.004 * (Module Temperature - 25)]}. The converted STC powers are S1, S2, S3, ..., Sn respectively. The average STC power = (S1 + S2 + ... + Sn) / N. Step 2: Calculate the dispersion rate (Coefficient of Variation, CV). The calculation formula is as follows: Dispersion Rate = (Standard Deviation / Average STC Power) * 100. Step 3: Mark abnormal strings: those lower than 12% of the average are judged as abnormal, while those equal to or higher than 12% are judged as normal.