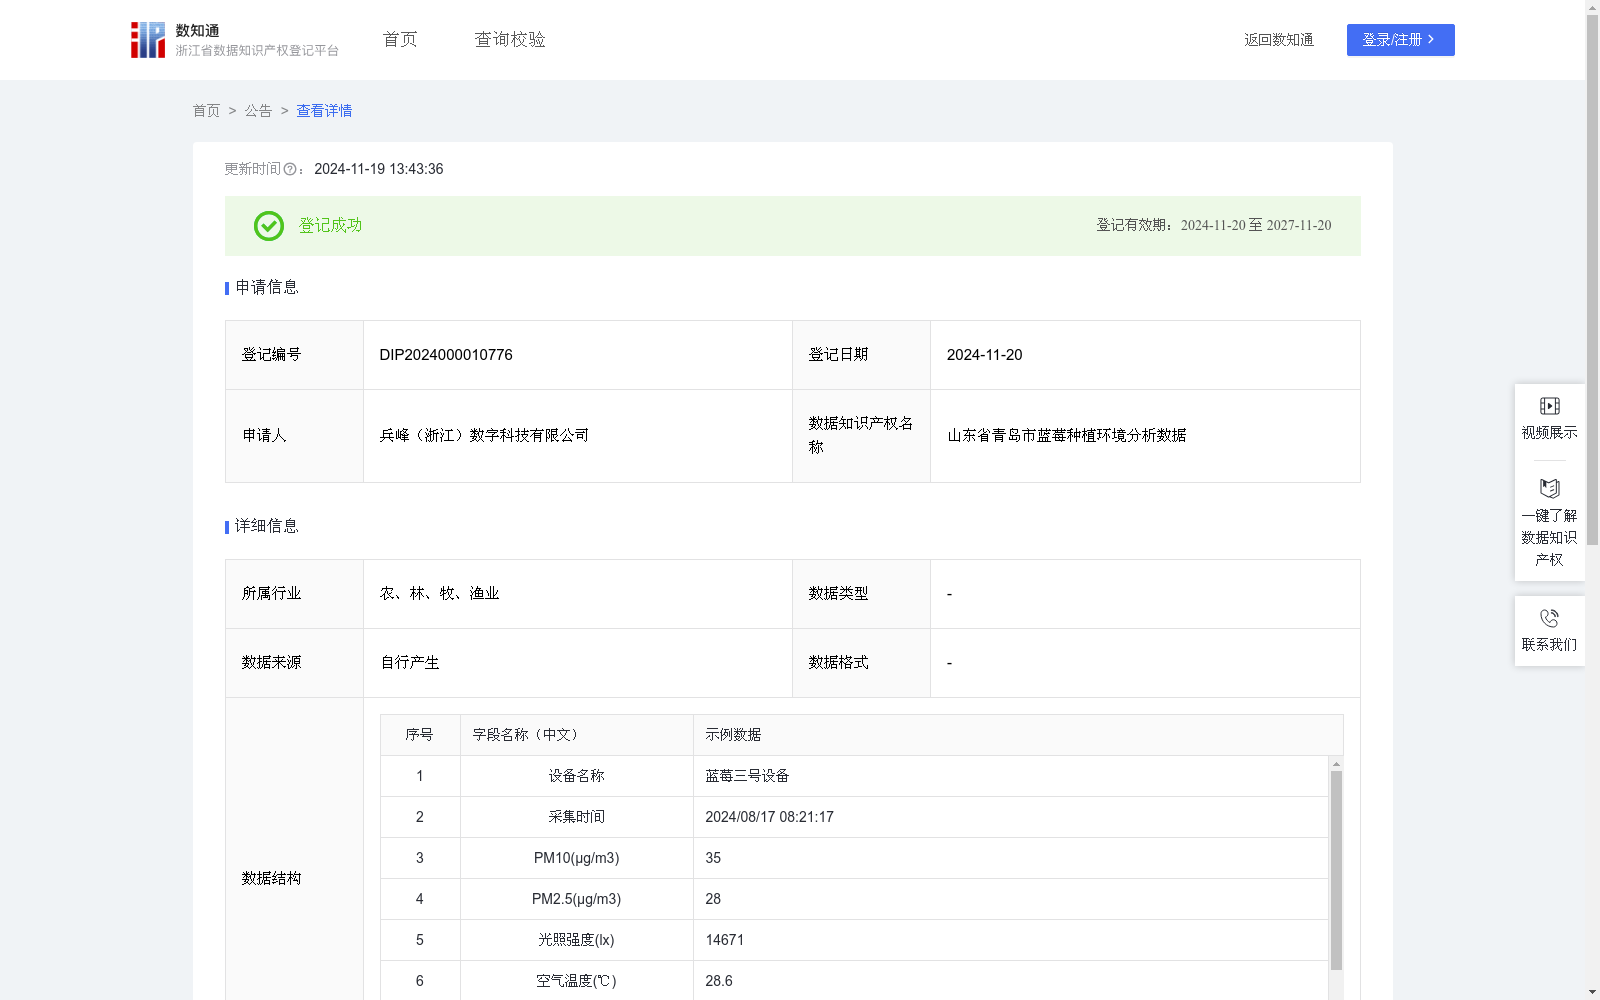
山东省青岛市蓝莓种植环境分析数据
收藏浙江省数据知识产权登记平台2024-11-19 更新2024-11-20 收录
下载链接:
https://www.zjip.org.cn/home/announce/trends/86235
下载链接
链接失效反馈资源简介:
采集蓝莓种植的空气温湿度、光照强度、PM10、PM2.5 等数据,全面评估不同环境条件对蓝莓生长的具体影响。精确确定适宜的空气温湿度组合,以利于蓝莓植株的茁壮成长和果实的良好发育。明确合适的光照强度和时长,保障蓝莓进行充分的光合作用,促使果实积累丰富的营养物质和风味成分。分析不同程度的 PM10 和 PM2.5 对蓝莓叶片及果实的潜在危害,防止空气污染降低蓝莓的品质和产量。进而为蓝莓的健康生长提供有力保障。利用这些数据构建蓝莓品质与环境参数关联的深度网络模型,深入探索何种环境条件组合可以使蓝莓具有更高的花青素含量、更浓郁的果香、更饱满的果实形态以及更好的口感等,为显著提升蓝莓品质奠定基础。基于数据驱动的方式,为蓝莓种植环境的智能调控提供有效的支持。依据实时数据自动调整灌溉量、通风强度以及防护措施等,为蓝莓创造适宜的生长环境,提高种植效率和产量。将优化后的环境调控经验推广应用至不同地区的蓝莓种植中,形成多维度细粒度的感知与控制模式,有力推动蓝莓种植产业朝着科学、高效、模式可移植的方向发展,全面提升整个蓝莓产业的竞争力。1.数据采集:本系统通过空气湿温度传感器、光照传感器、PM传感器等物联网设备,结合4G/5G、Wi-Fi与有线网络,实时采集种植环境中的空气湿温度、光照、PM10、PM2.5等多维数据。 2.算法规则:系统采用环境参数评分算法,对环境数据进行评分。基于作物生长理想条件(如温度、湿度、PM值等),并通过以下公式计算:环境参数评分=100-Σ(w_i×|当前值_i-理想值_i|/容差_i),其中,Σ表示对所有参数的累加,w_i是第i个参数的权重。当前值_i是第i个参数的实际测量值,理想值_i是第i个参数的理想值。容差_i是第i个参数的允许波动范围。权重、理想值和容差范围设定基于历史数据分析以及实际种植经验的确定。对作物生长影响较大的参数获得较高的权重。容差范围则考虑到环境因素的波动性,针对作物对不同环境变化的耐受性设定进行适当设定,环境参数偏离理想值越多,扣分越大,以空气温度为例,其权重为3,理想值设定为22℃,容差范围为±3℃,扣分计算如下:空气温度扣分=3×|28.6-22|/3=3×2.2=6.6。根据这些评分生成具体的环境优化方案。
This dataset collects multi-dimensional environmental data including air temperature and humidity, light intensity, PM10, PM2.5, etc. from blueberry plantations, to comprehensively evaluate the specific impacts of different environmental conditions on blueberry growth. We aim to accurately determine the optimal air temperature and humidity combinations to facilitate the vigorous growth of blueberry plants and the proper development of their fruits. We also define appropriate light intensity and duration to ensure adequate photosynthesis in blueberries, promoting the accumulation of rich nutrients and flavor components in their fruits. Additionally, we analyze the potential hazards of different levels of PM10 and PM2.5 to blueberry leaves and fruits, so as to prevent air pollution from reducing blueberry quality and yield, thereby providing strong support for the healthy growth of blueberries.
Using these data, we construct a deep neural network model that correlates blueberry quality with environmental parameters, and deeply explore which environmental condition combinations can endow blueberries with higher anthocyanin content, stronger fruit aroma, plumper fruit morphology, better taste, etc., laying a solid foundation for significantly improving blueberry quality. Data-driven methods are employed to provide effective support for the intelligent regulation of blueberry planting environments: the system automatically adjusts irrigation volume, ventilation intensity, protective measures, etc. based on real-time data, creating suitable growth environments for blueberries and improving planting efficiency and yield.
The optimized environmental regulation experience will be promoted and applied to blueberry plantations in different regions, forming a multi-dimensional and fine-grained perception and control model, effectively promoting the development of the blueberry planting industry towards a scientific, efficient, and transplantable direction, and comprehensively enhancing the competitiveness of the entire blueberry industry.
1. Data Collection: This system collects real-time multi-dimensional environmental data including air temperature and humidity, light intensity, PM10, PM2.5, etc. from blueberry plantations via IoT devices such as air temperature and humidity sensors, light sensors, and PM sensors, combined with 4G/5G, Wi-Fi and wired networks.
2. Algorithm Rules: The system adopts an environmental parameter scoring algorithm to evaluate environmental data. Based on the ideal growth conditions for crops (including temperature, humidity, PM values, etc.), the score is calculated using the following formula:
Environmental Parameter Score = 100 - Σ(w_i × |Current Value_i - Ideal Value_i| / Tolerance_i)
where Σ denotes the sum over all parameters, w_i is the weight of the i-th parameter, Current Value_i is the actual measured value of the i-th parameter, Ideal Value_i is the ideal value of the i-th parameter, and Tolerance_i is the allowable fluctuation range of the i-th parameter.
The weights, ideal values and tolerance ranges are determined based on historical data analysis and actual planting experience. Parameters exerting greater impacts on crop growth are assigned higher weights. The tolerance ranges are set appropriately considering the volatility of environmental factors and the crop's tolerance to varying environmental changes. The greater the deviation of environmental parameters from the ideal values, the larger the score deduction. Taking air temperature as an example, its weight is 3, the ideal value is set to 22℃, and the tolerance range is ±3℃. The score deduction for air temperature is calculated as:
Air Temperature Score Deduction = 3 × |28.6 - 22| / 3 = 3 × 2.2 = 6.6.
Specific environmental optimization schemes are generated based on these scores.
提供机构:
兵峰(浙江)数字科技有限公司
创建时间:
2024-10-08
AI搜集汇总
数据集介绍
特点
该数据集包含山东省青岛市蓝莓种植环境的空气温湿度、光照强度、PM10和PM2.5等多维数据,共609条,每日更新。主要用于评估环境条件对蓝莓生长的影响,并支持智能调控种植环境。
以上内容由AI搜集并总结生成


